
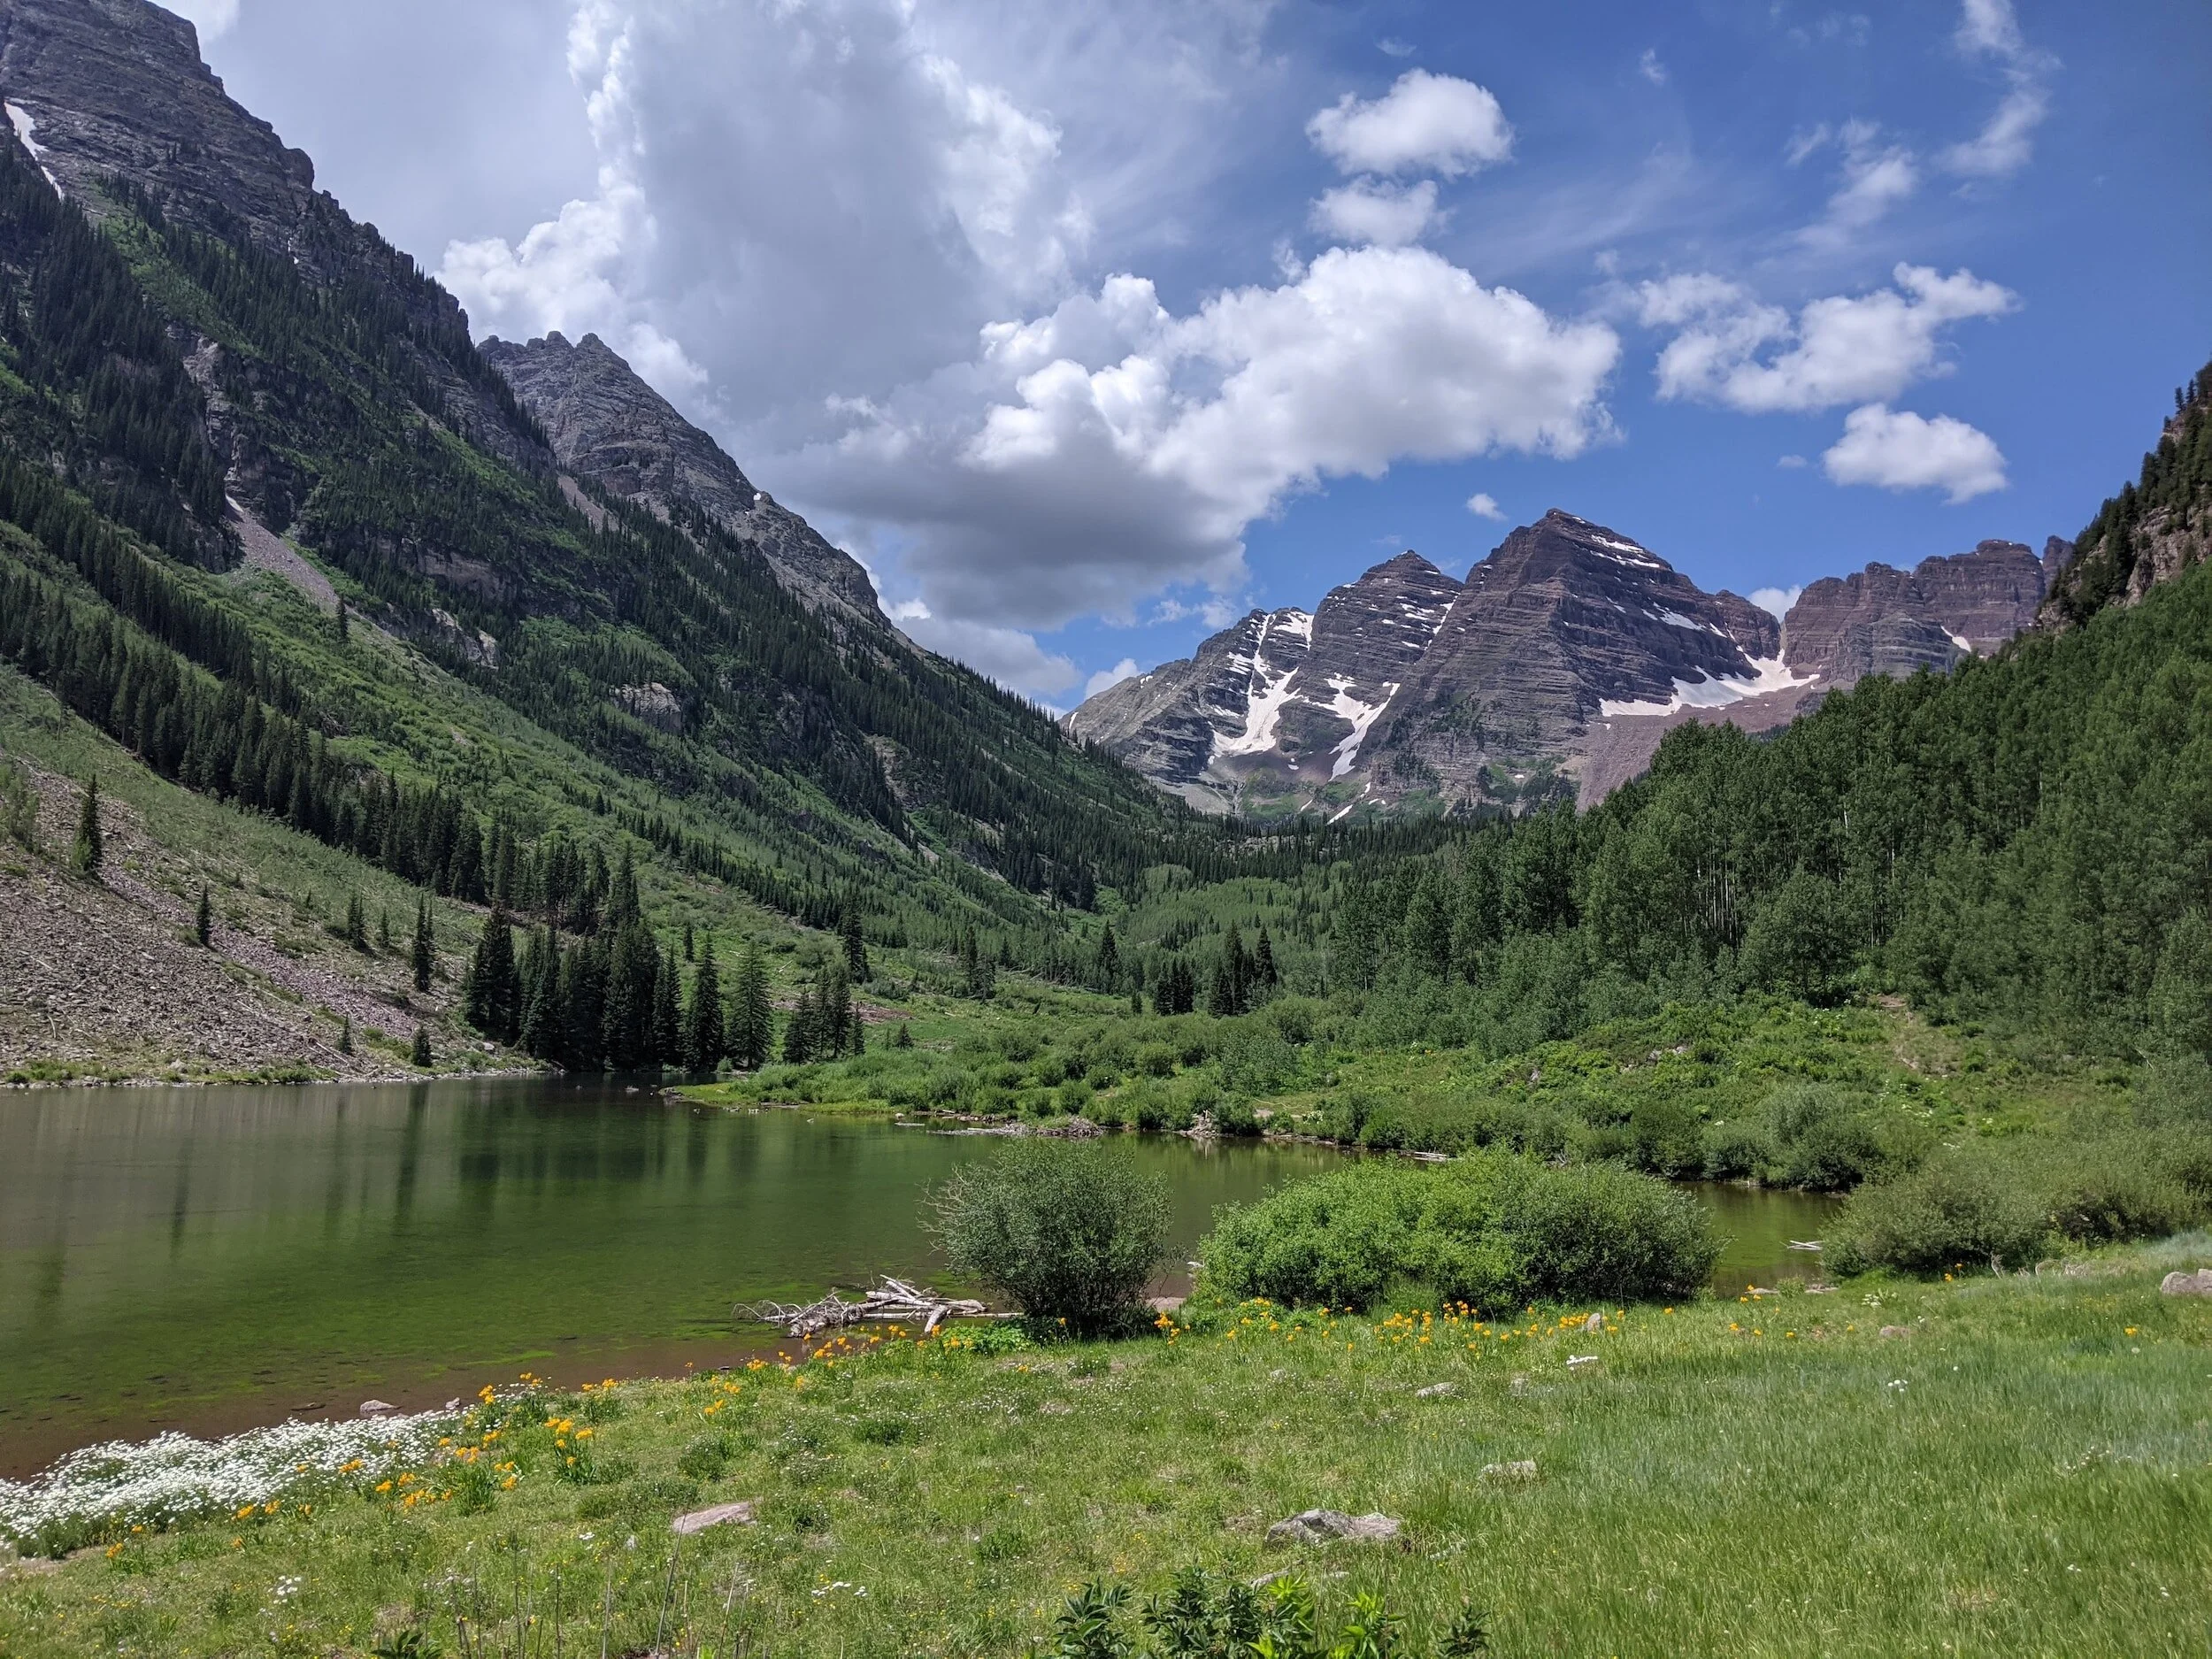

Aboveground Biomass On Niwot Ridge
The Niwot Ridge LTER has tracked aboveground biomass— a measure of plant productivity— in an alpine meadow since the early 1990s. To learn more, explore our long-term data, visualized below.
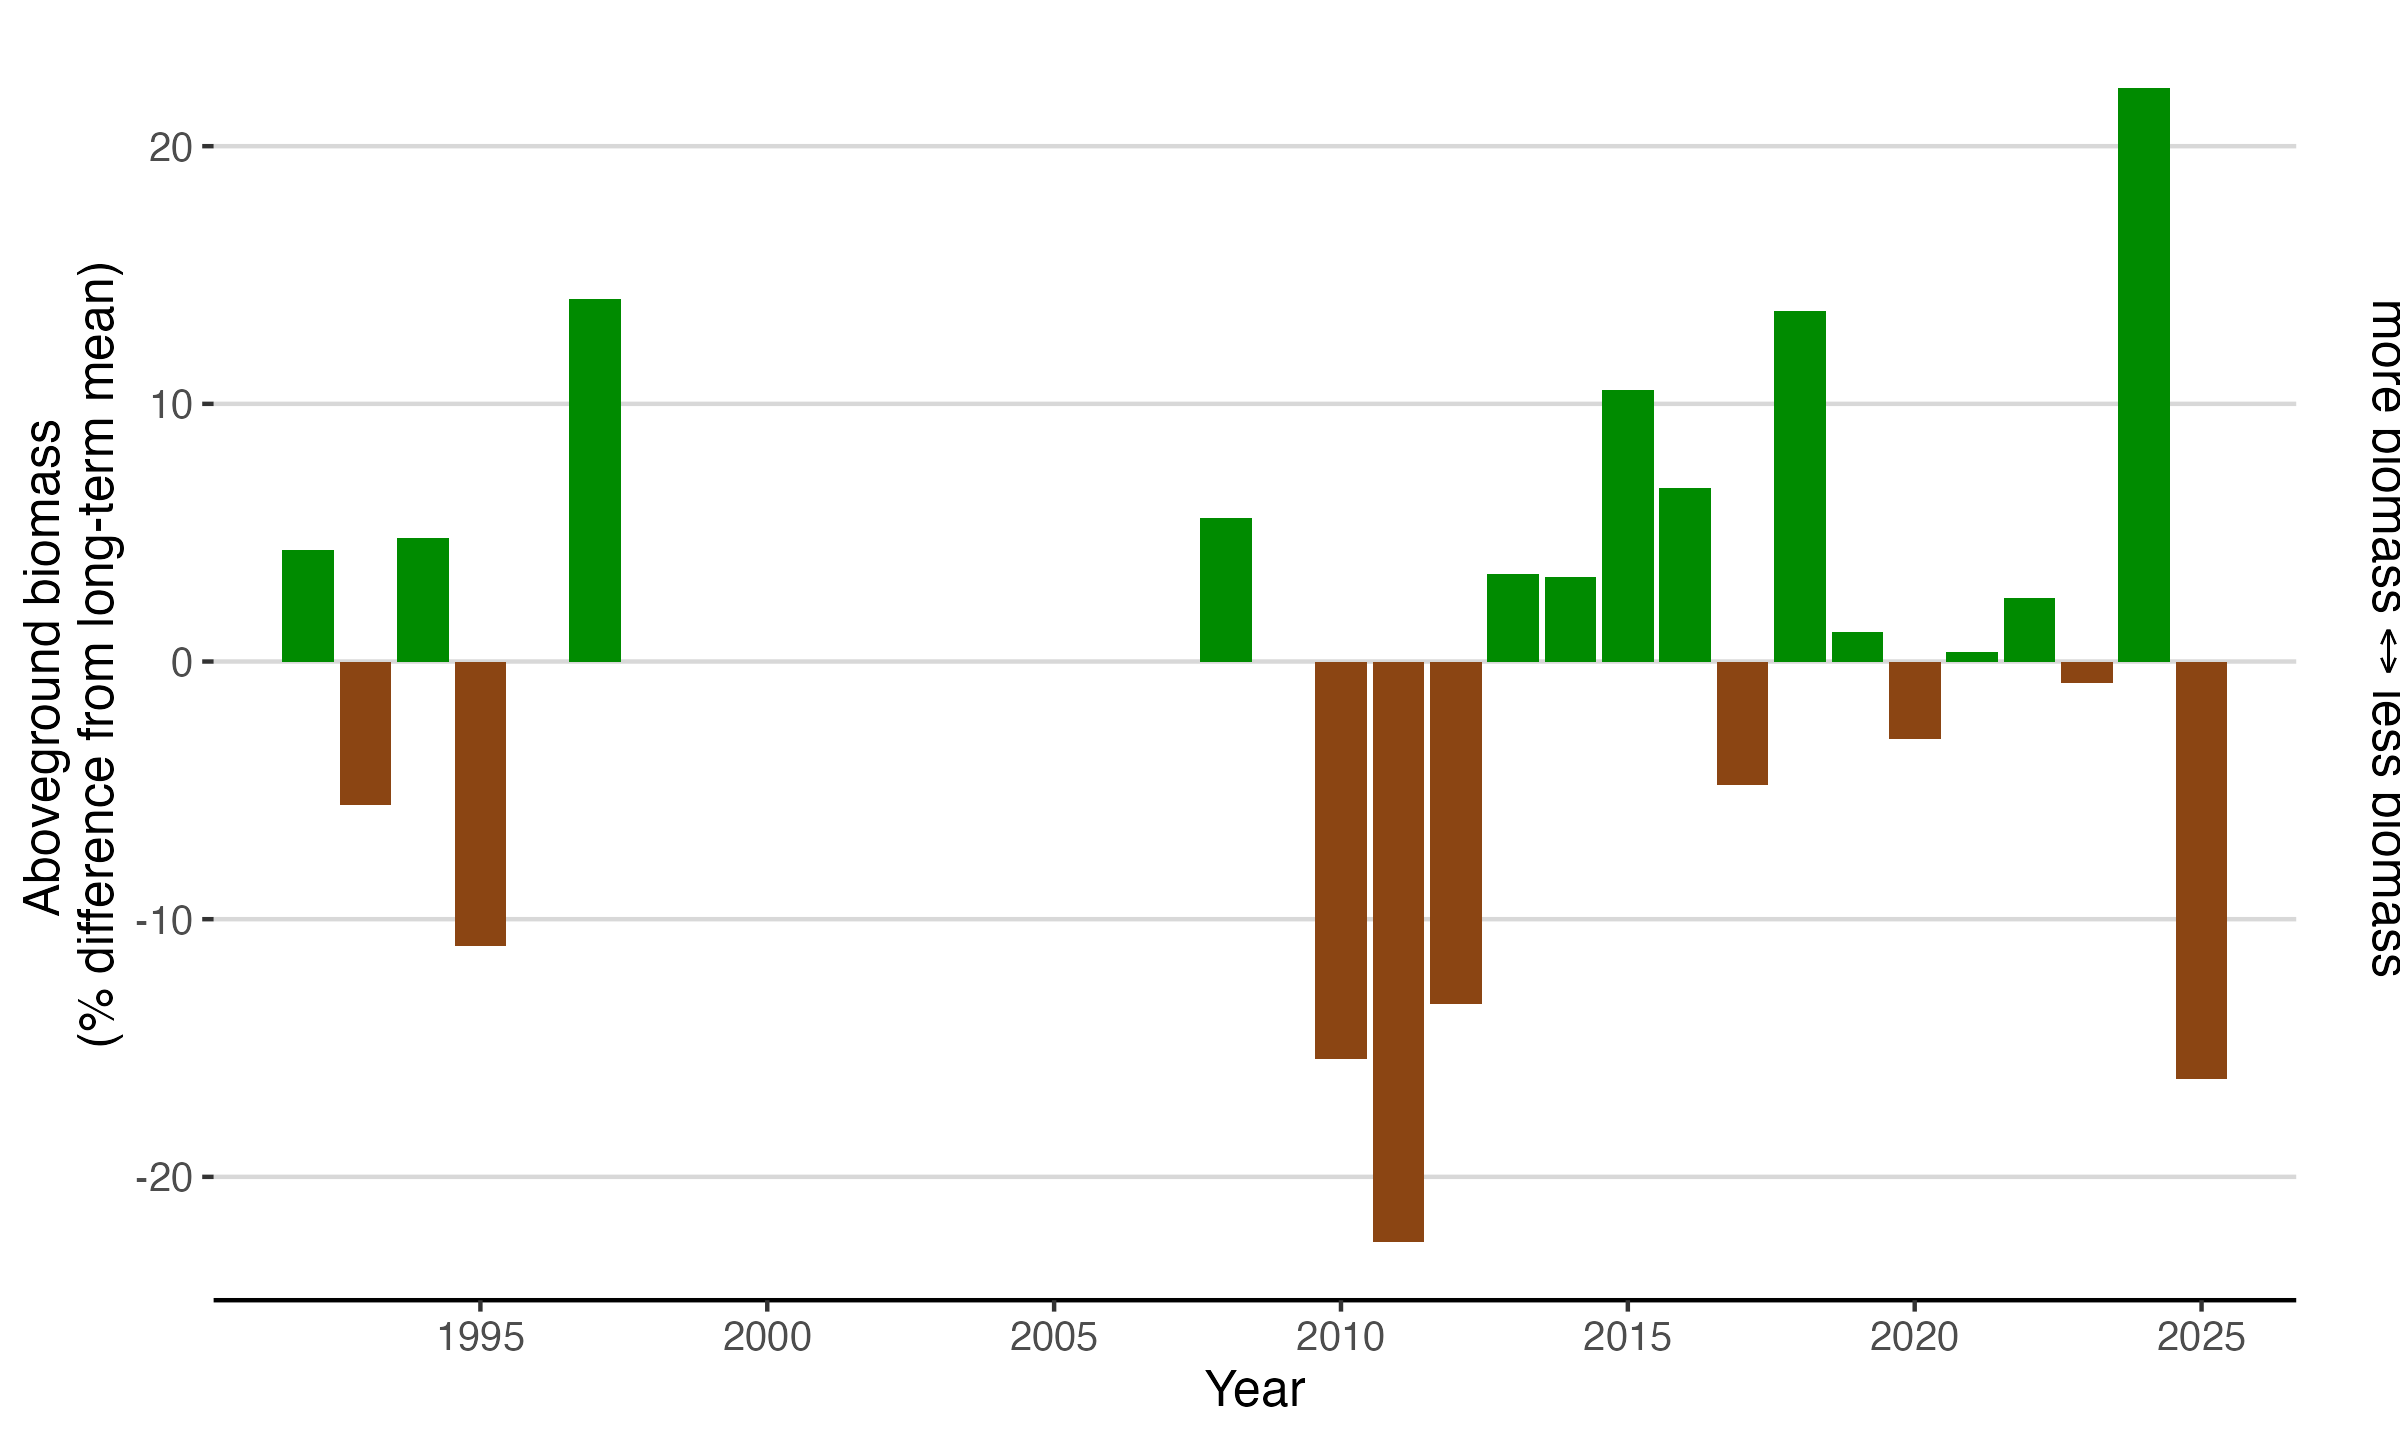
Annual Anomalies in Aboveground Biomass
The figure visualized below shows annual deviation in aboveground biomass from the long-term mean in an alpine dry meadow on Niwot Ridge. Aboveground biomass is measured as net primary production (NPP) and averaged across all vegetation types. Positive values, in green, indicate more biomass than average while negative values, in brown, indicate less biomass than average.
Download Aboveground Biomass Data and Code
The long-term data and code used to make the figures on this page are publicly available on GitHub and Environmental Data Initiative Data Portal.
Figures, content, and data on this page may be used with proper citation.
about Aboveground Biomass Data from Niwot Ridge
Field Site:
The aboveground biomass data visualized on this page is collected in an alpine dry meadow on the Saddle of Niwot Ridge (Figs. 1, 2).

Figure 1: Climate stations of the Niwot Ridge LTER. Blue stars indicate the location of the subalpine (C1), Saddle, and alpine (D1) climate stations.
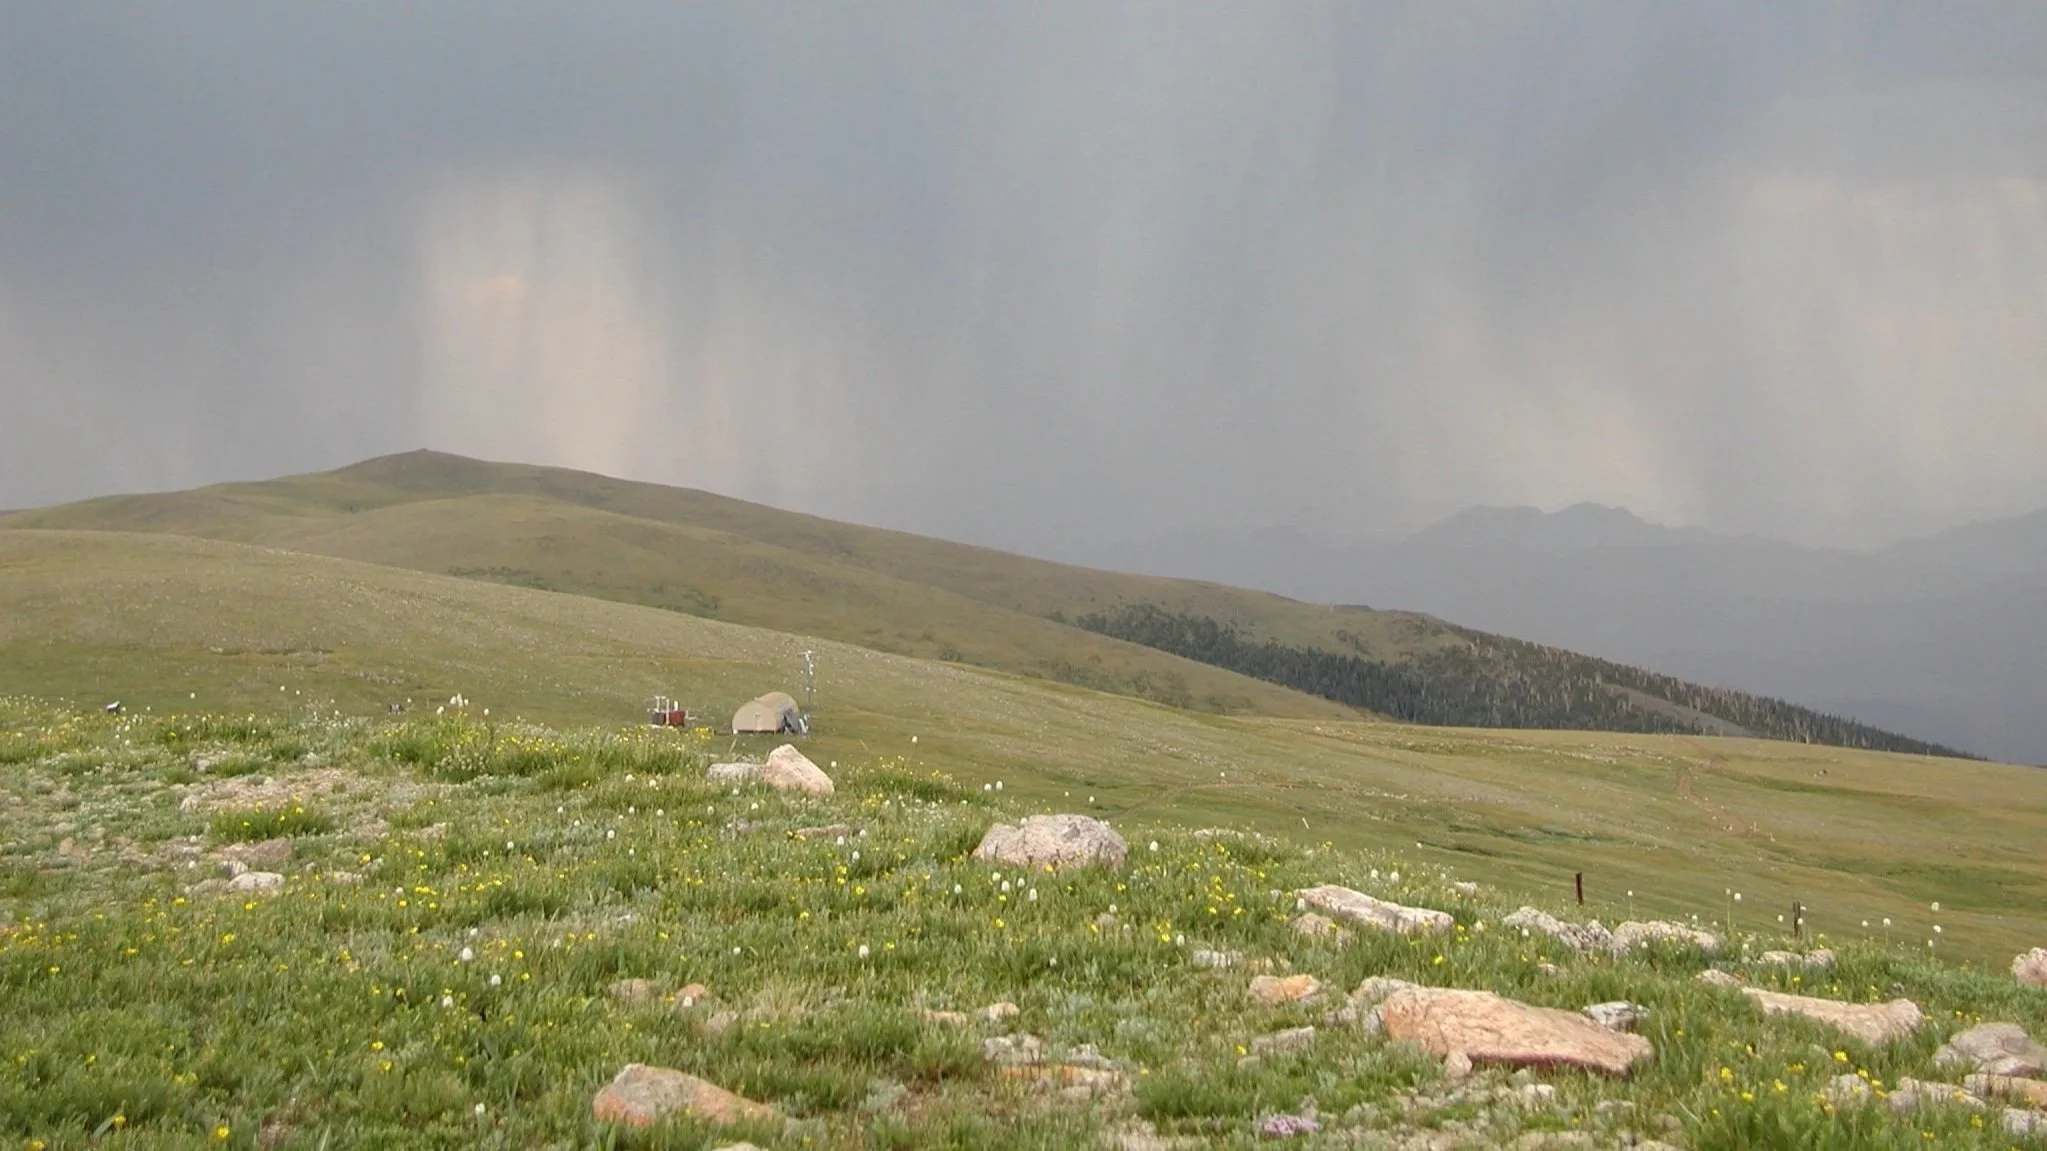
Figure 2: The Saddle on Niwot Ridge. The Niwot Ridge saddle is located 5.6 km from the Continental Divide. The area is located along a ridge-top, but in a shallow saddle between the east and west knolls. There is a 10,000 sq ft tundra laboratory on the south side of the saddle, which serves as a staging area for research in all weather conditions
Data Collection:
Researchers harvest aboveground biomass from 20 x 50 cm (0.1 m^2) quadrats placed outside of 88 permanent vegetation plots at the Saddle research site (Fig. 3). Scissors or razor blades are used to clip the current year’s growth of vascular plants, and harvested material is placed into paper bags (Fig. 4). Quadrats are marked with a whisker to ensure that the same location is not sampled the following year (Fig. 5). Following collection, aboveground biomass is taken to the lab, dried, and weighed.
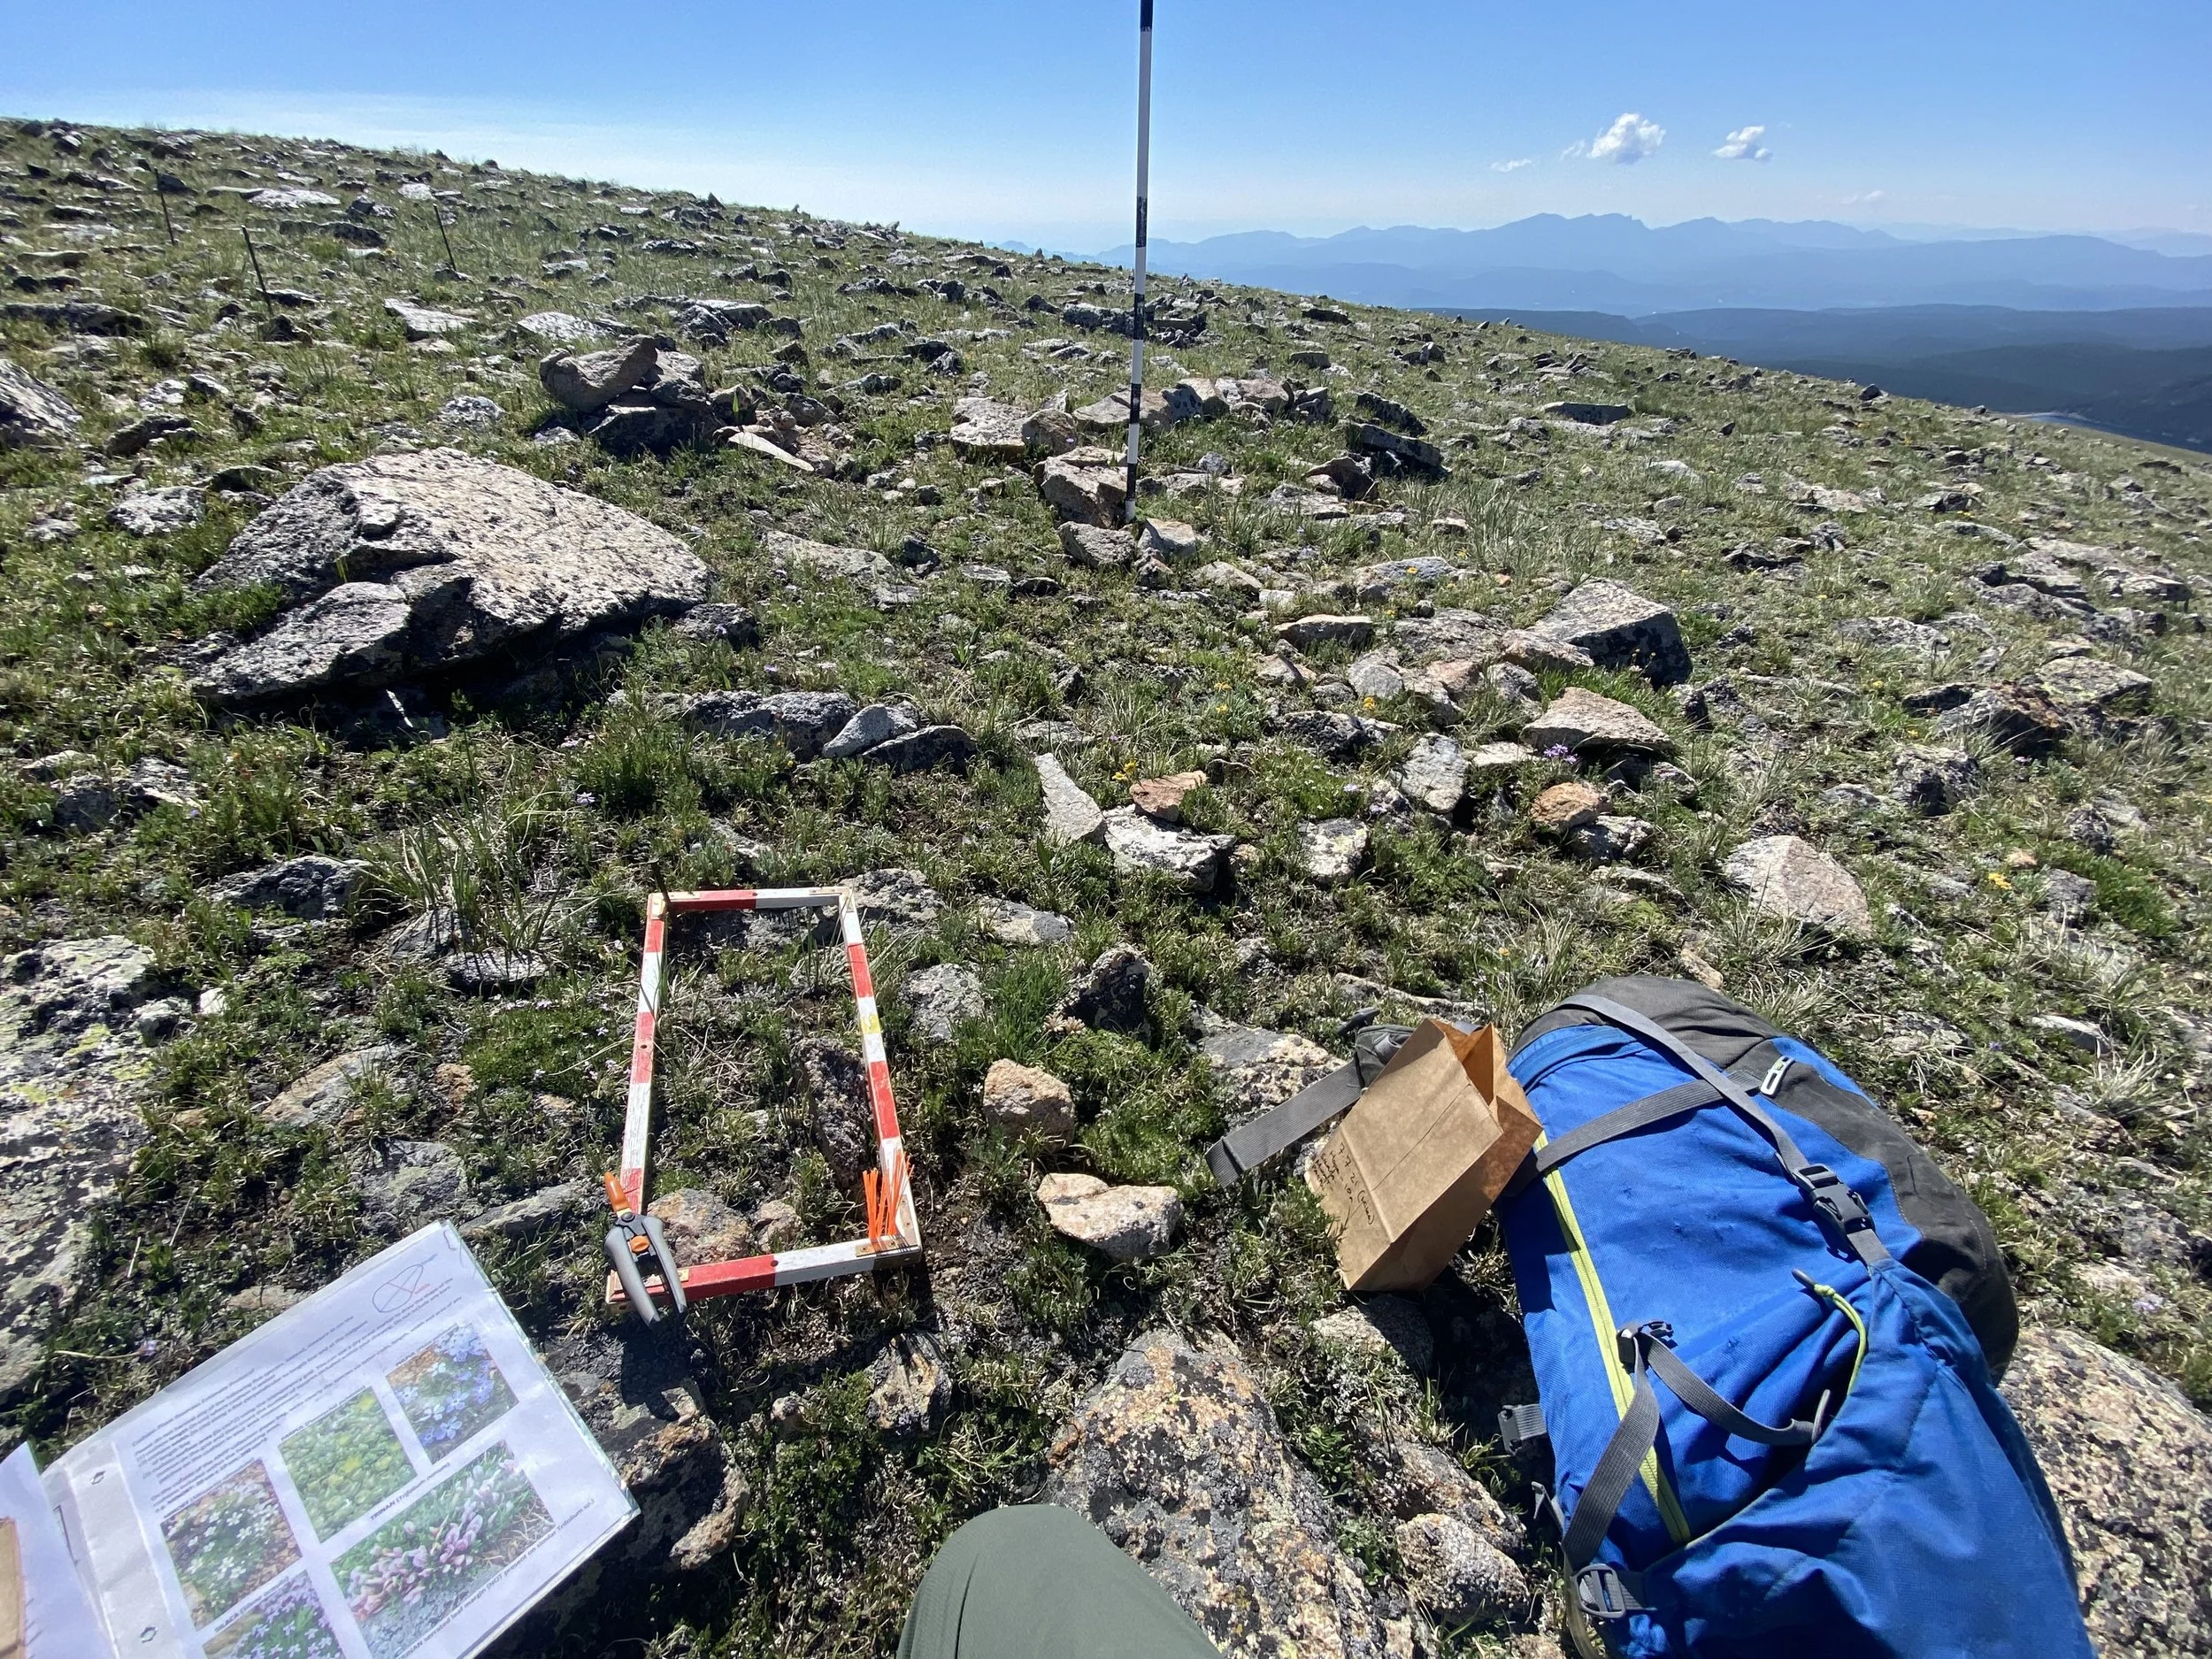
Figure 3: Each year, researchers collect aboveground biomass from small quadrats placed near associated permanent vegetation plots on the Saddle of Niwot Ridge. Photo by Miles Moore.
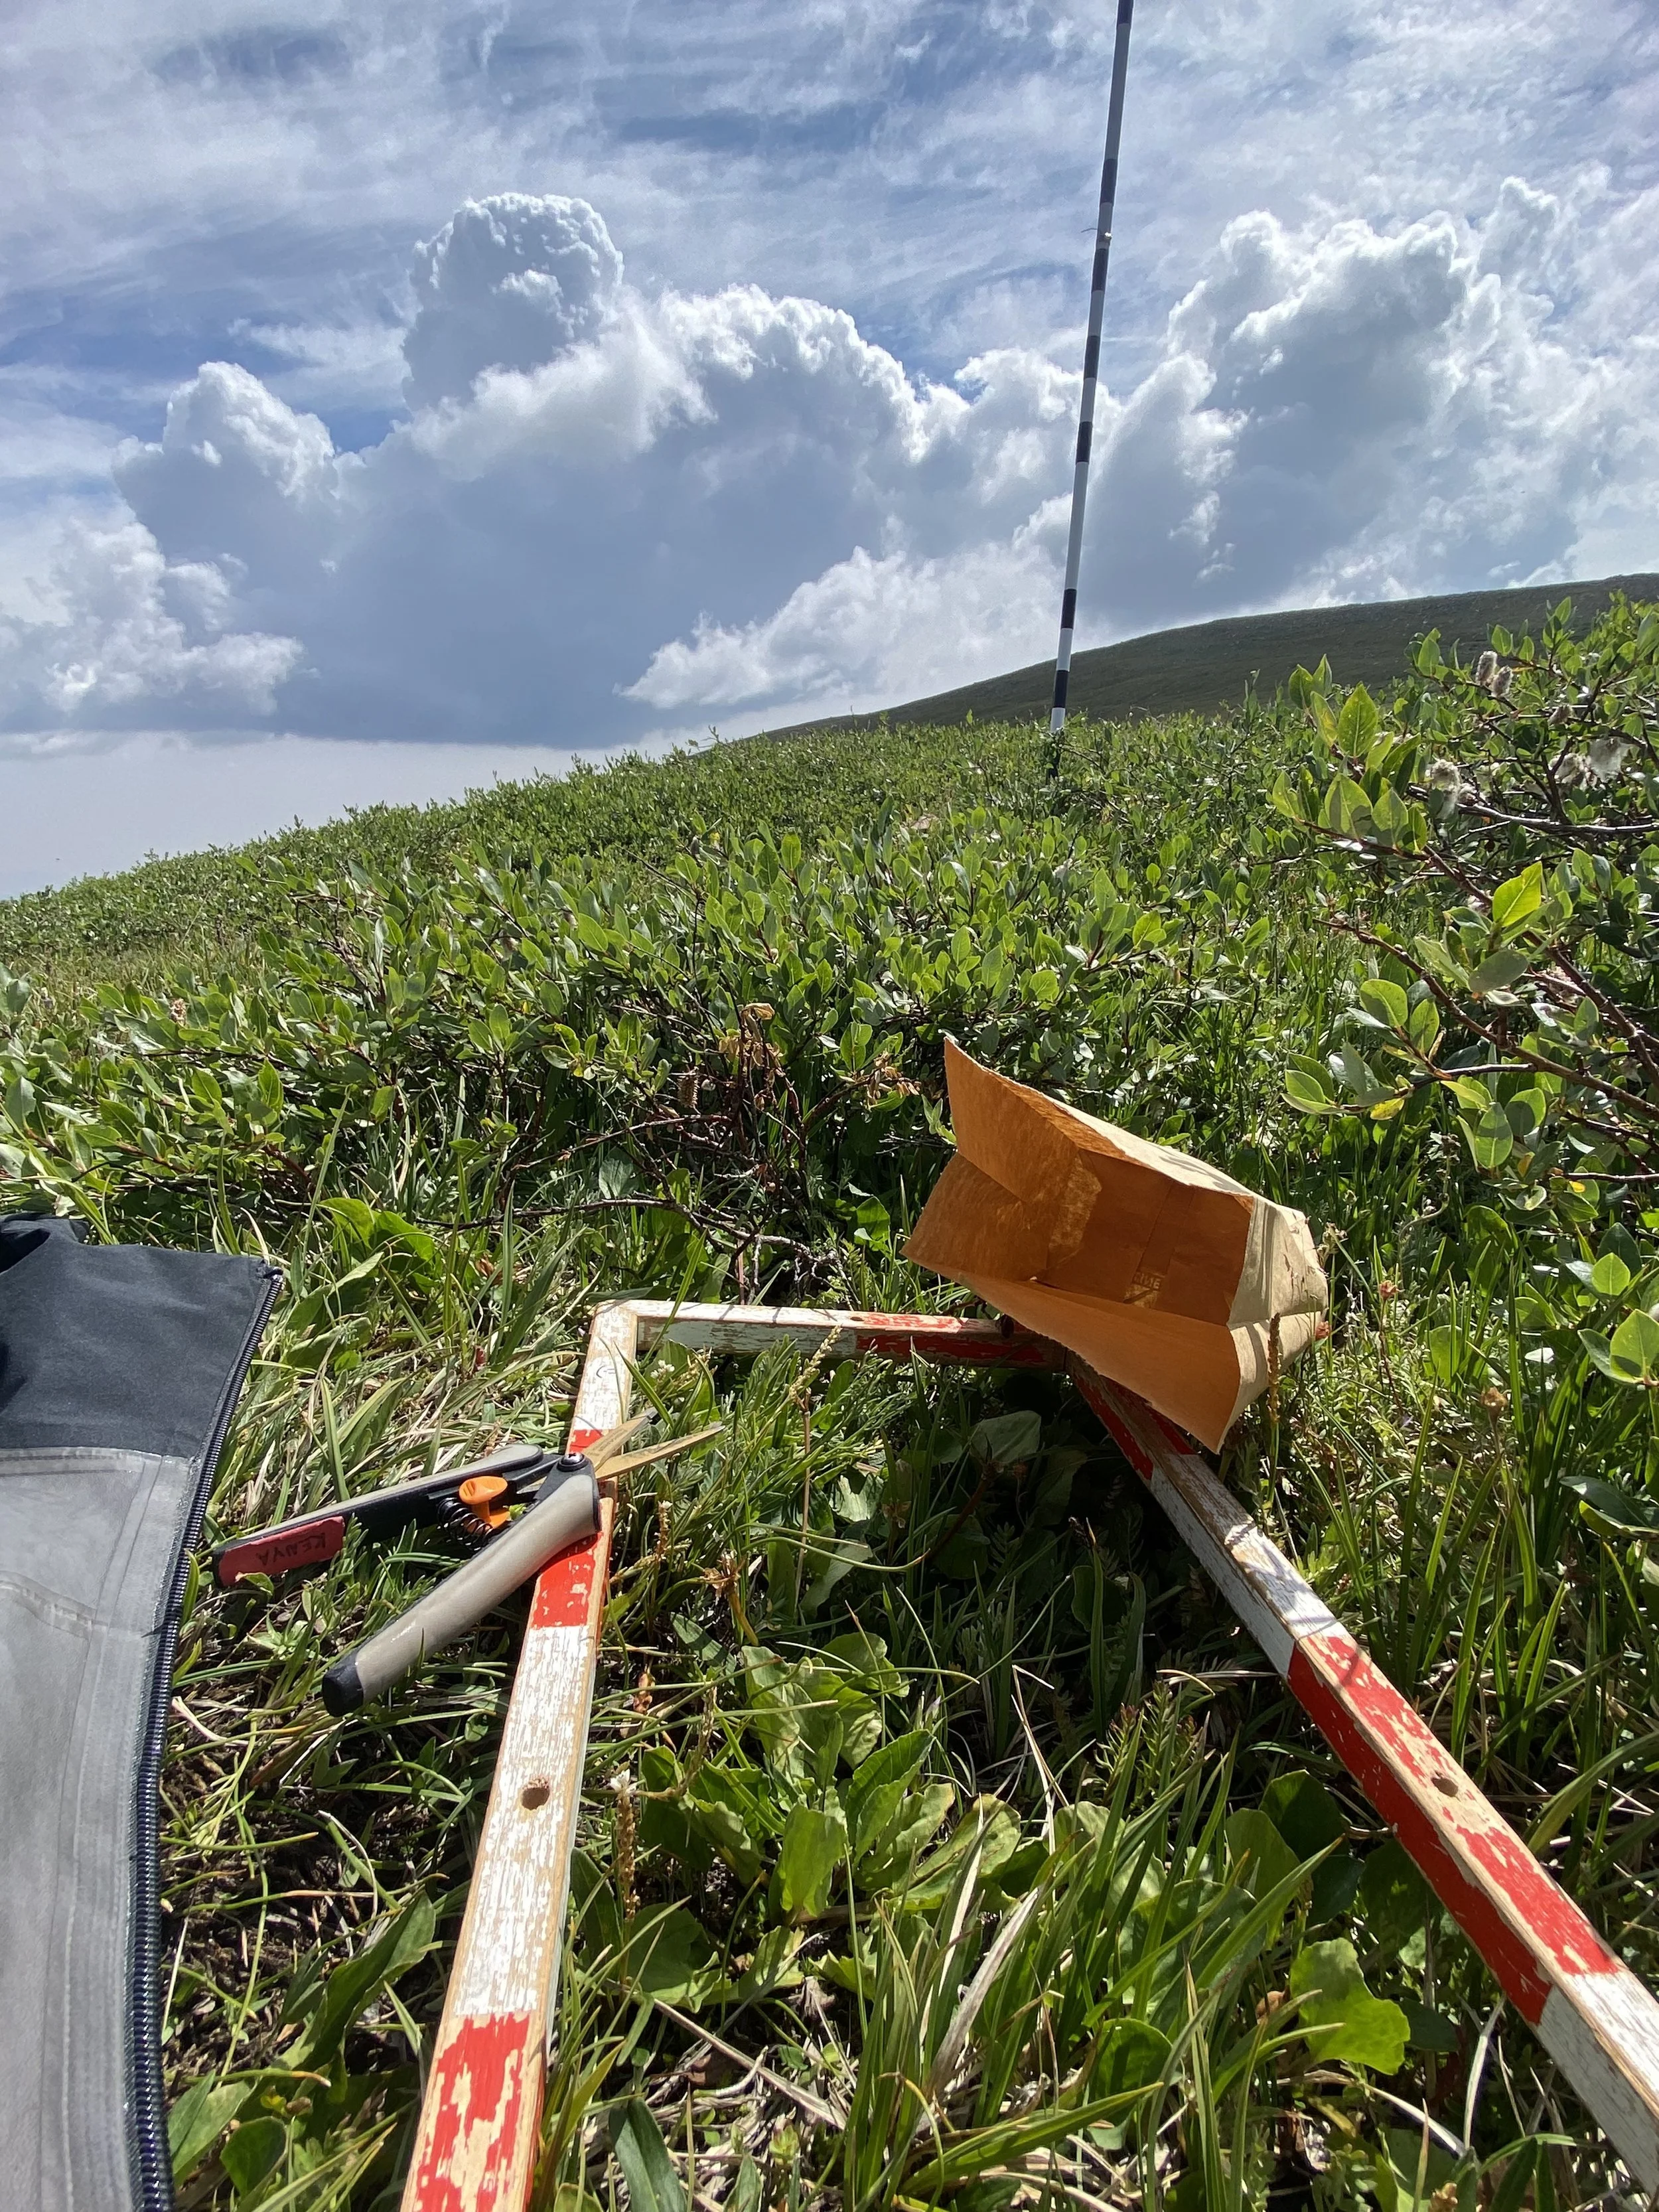
Figure 4: Researchers clip the current year’s aboveground biomass and place it into paper bags to be dried and weighed. Photo by Miles Moore.
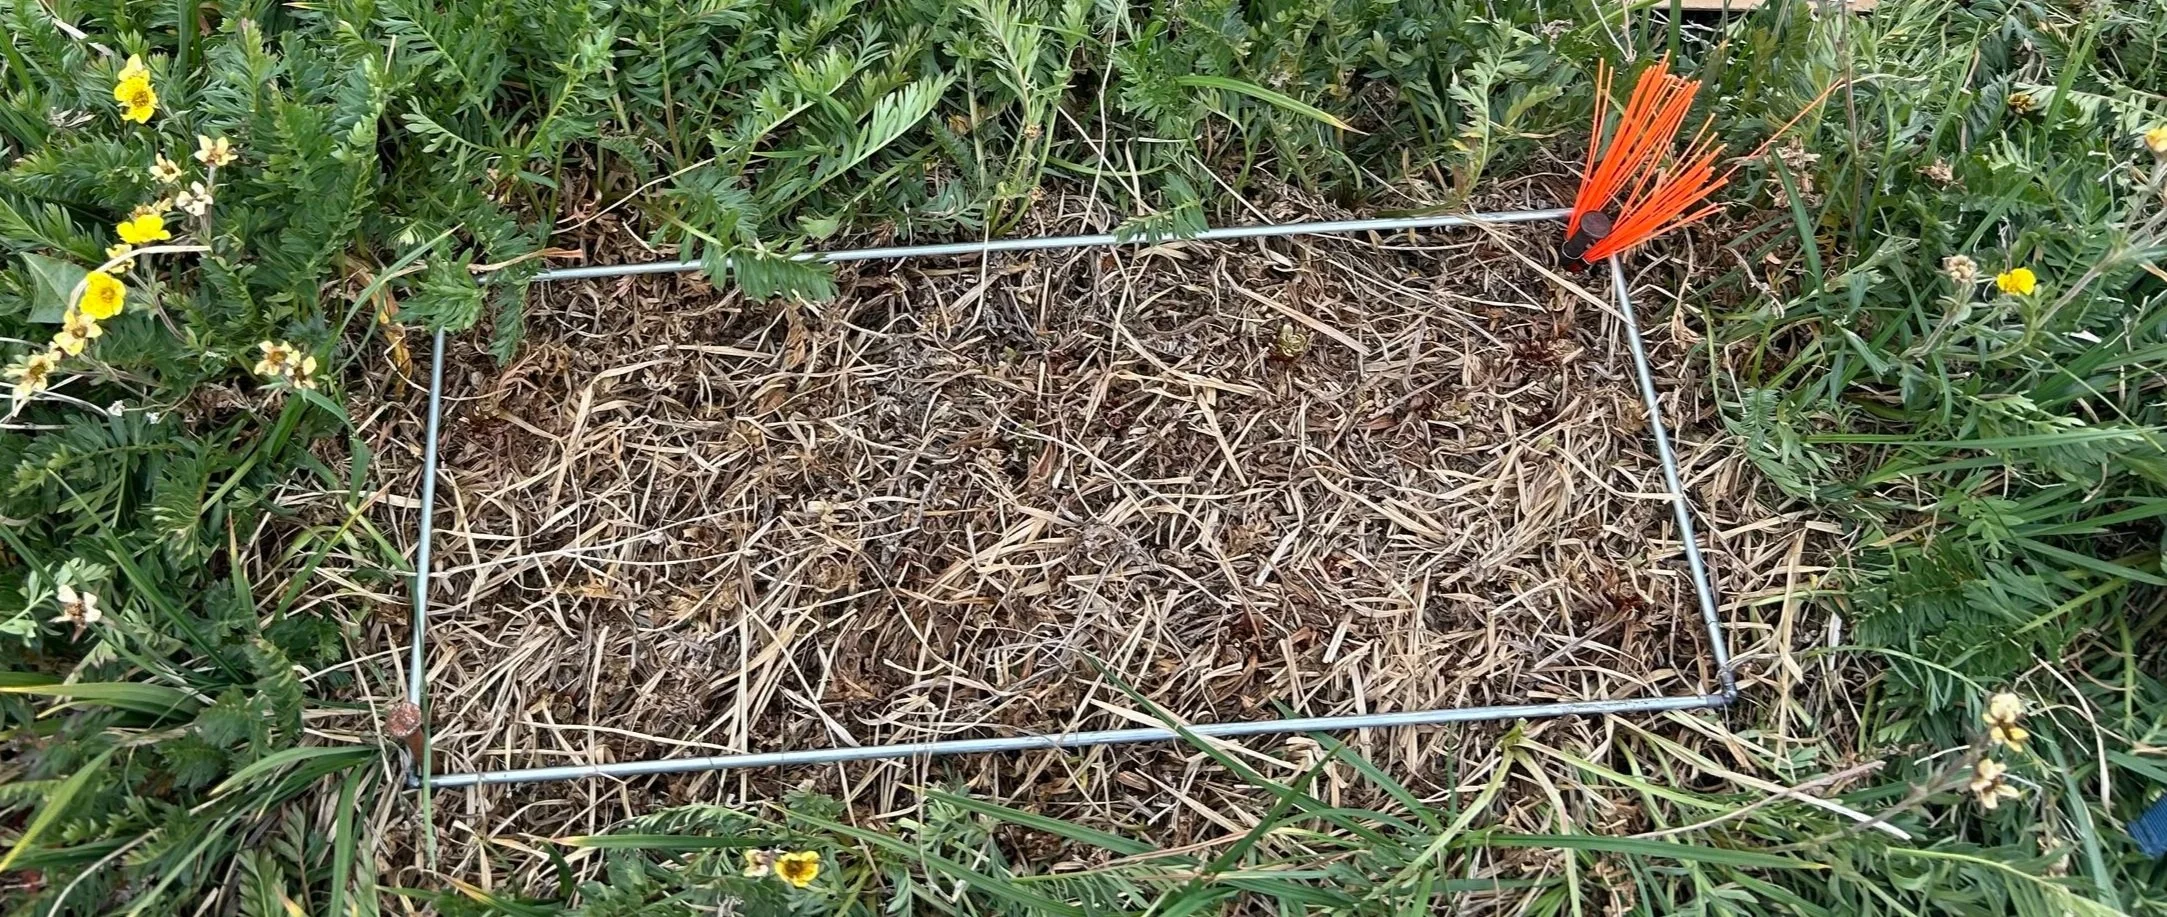
Figure 5: Whiskers mark the location of harvested quarats so that the same location is not sampled the following year. Photo by Lina Wieprecht.
How To Cite Data and Figures On this page
The Niwot Ridge LTER welcomes use of the figures and content on this page when accompanied by the following citation:
Niwot Ridge LTER. 2026. Data Dashboard. Retrieved from https://nwt.lternet.edu/aboveground-biomass.
We also welcome your use of the data linked to on this page when accompanied by the following citations:
Walker, M., H. Humphries, and Niwot Ridge LTER. 2026. Plant species composition data for Saddle grid, 1989 - ongoing. ver 11. Environmental Data Initiative. https://doi.org/10.6073/pasta/9f12b06bbaf0b2e2ebb129afab46f4f4.
Walker, M., J. Smith, H. Humphries, and Niwot Ridge LTER. 2025. Aboveground net primary productivity data for Saddle grid, 1992 - ongoing. ver 10. Environmental Data Initiative. https://doi.org/10.6073/pasta/5d013d5908bf787b7aabd5ba08ac71f5
These Niwot Ridge data packages are hosted on the Environmental Data Initiative Data Portal. Each data package includes detailed information about where and how our aboveground biomass data are recorded and processed.
Contact Us
If you have questions about the data presented on this page, please email the Niwot Ridge LTER. To learn more about research, education, and outreach conducted by the Niwot Ridge LTER, please visit our website.