
Streamflow On Niwot Ridge
The Niwot Ridge LTER has monitored streamflow on Niwot Ridge and in the Green Lakes Valley since the 1980s. To learn more, explore our long-term streamflow data, visualized below.
Temporal Variation in Summer Streamflow
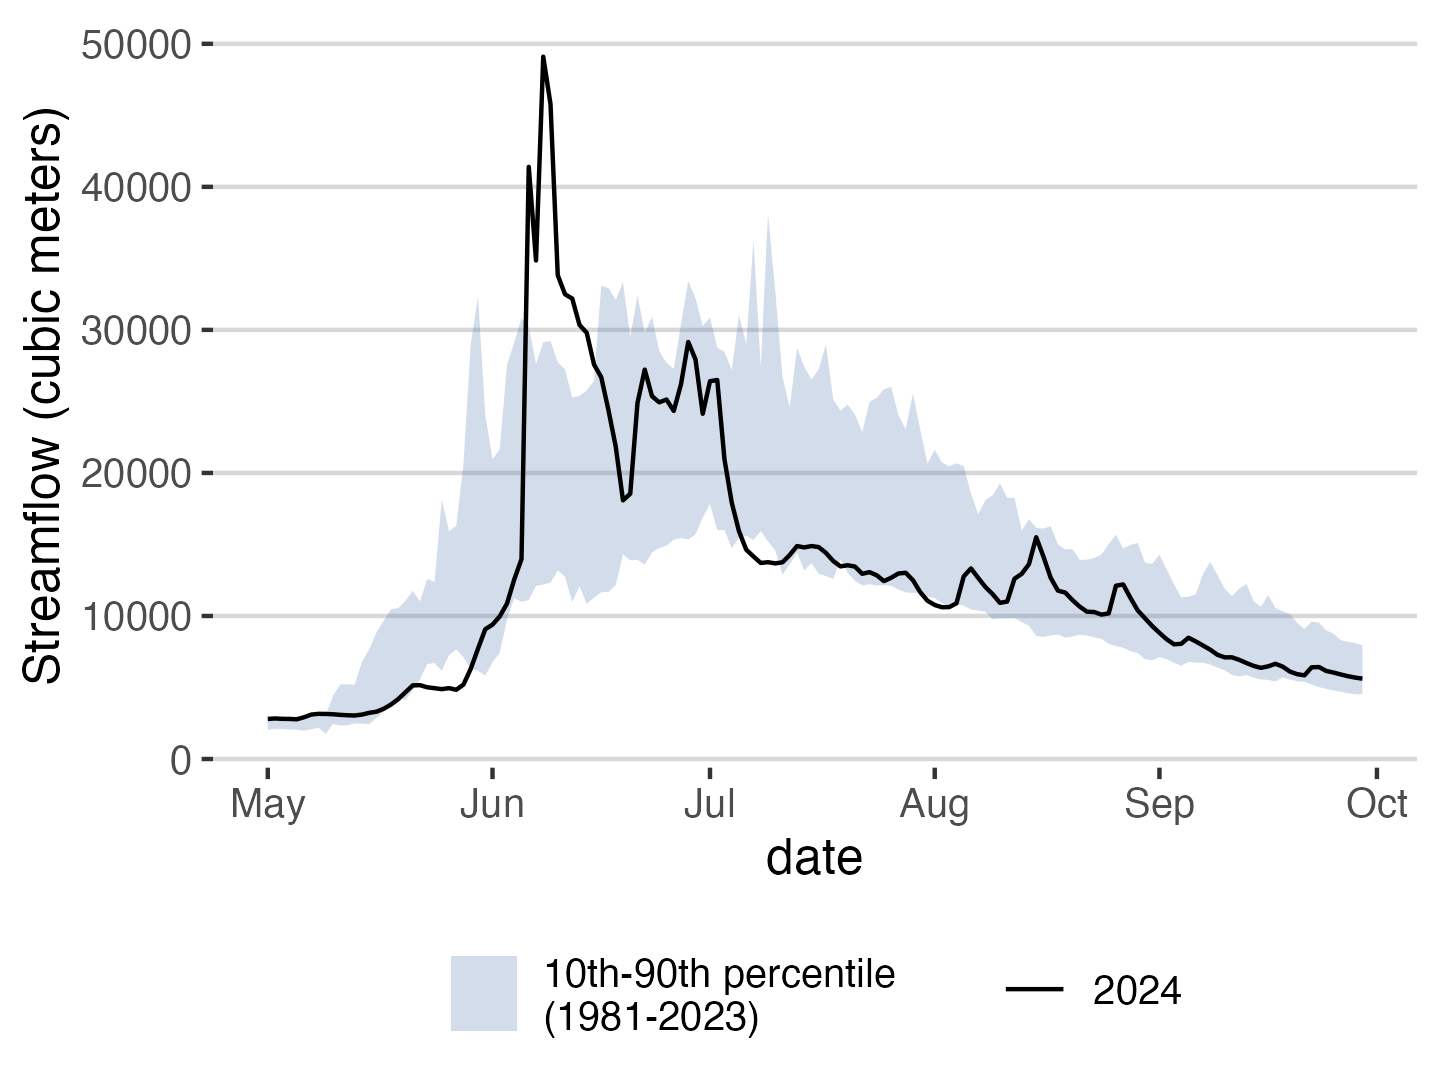
The below figure visualizes how streamflow out of an alpine lake varies by month relative to the historical streamflow pattern. The black line shows streamflow data from a recent year, and shading indicates the 10th through 90th quantiles for a given day across the long-term streamflow record (1981- present).
Anomalies in Annual Streamflow by Site
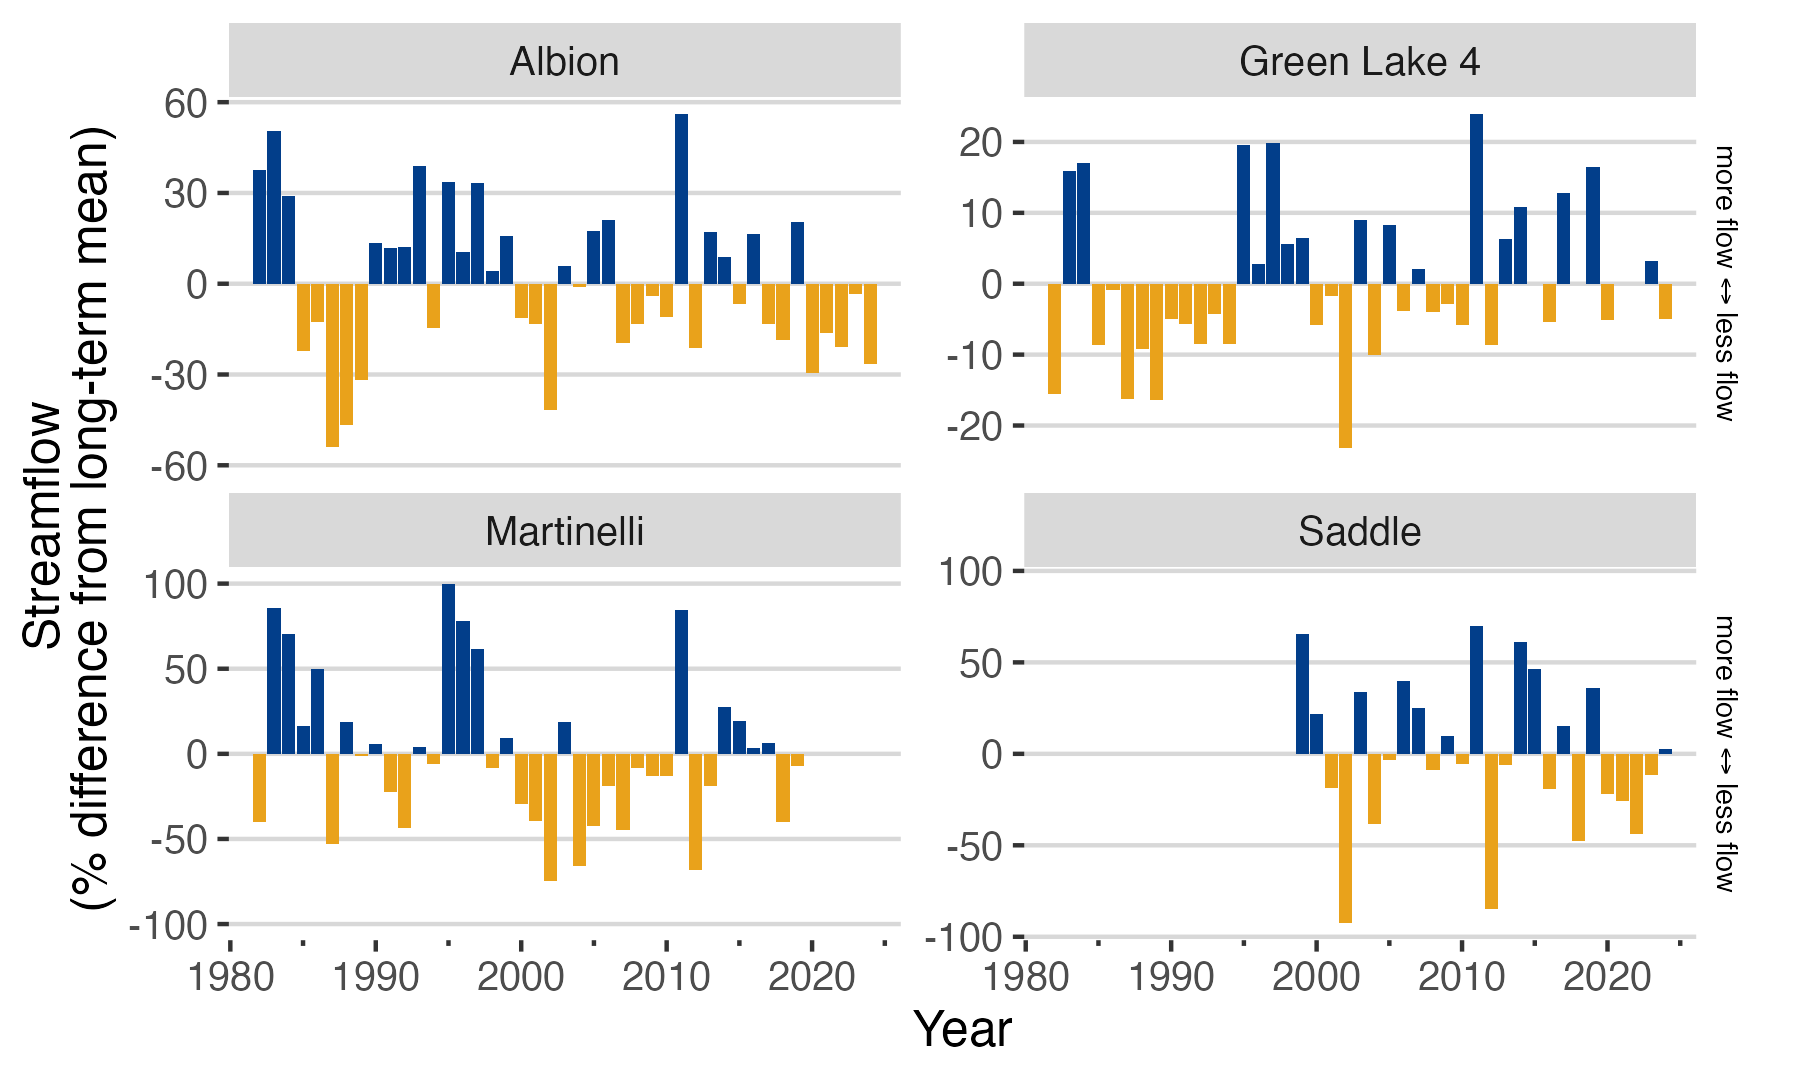
The below figure visualizes how annual streamflow deviates from the long-term average at four sites on Niwot Ridge. Data for years with higher streamflow than average are in blue, and data for years with lower streamflow than average are in gold.
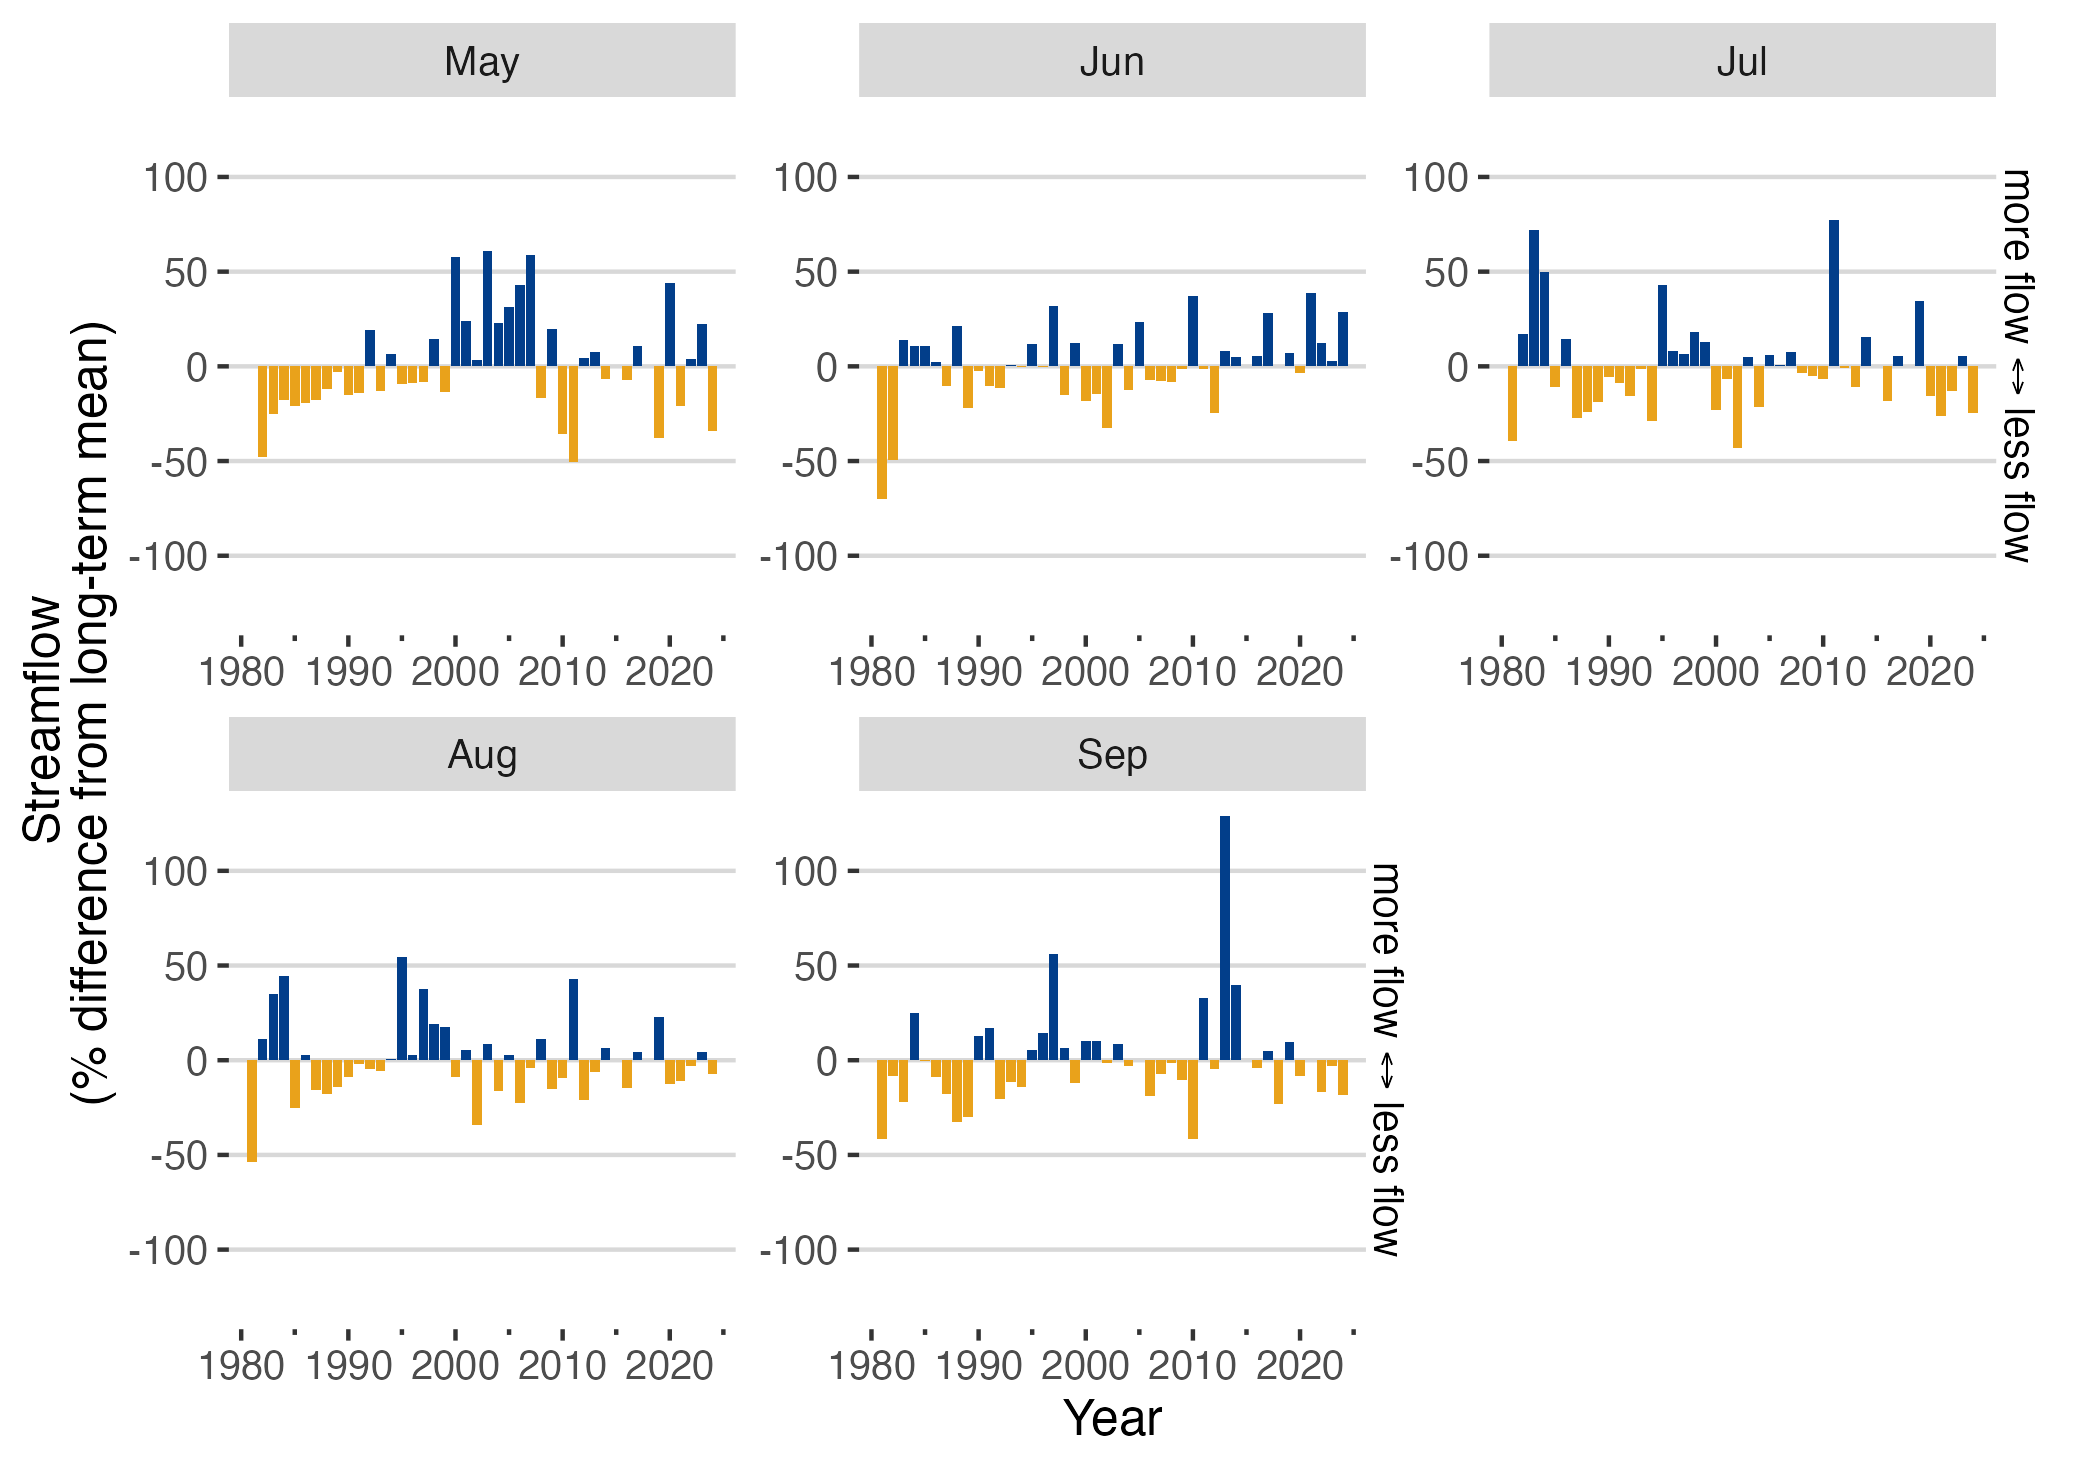
Anomalies in Summer Streamflow by Month
The below figure visualizes how summer streamflow from Green Lake 4 deviates from average across the long-term record. Data for years with higher streamflow than average are in blue, and data for years with lower streamflow than average are in gold.
Download Streamflow Data and Code
The long-term data and code used to make the figures on this page are publicly available on GitHub and the Environmental Data Initiative Portal.
*Figures, content, and data on this page may be used with proper citation.
about Streamflow Data from Niwot Ridge
Field Sites:

Figure 1: Climate stations of the Niwot Ridge LTER. Blue stars indicate the location of the subalpine (C1), Saddle, and alpine (D1) climate stations.
Instrumentation and Data Collection:
How To Cite Figures and Data On this page
The Niwot Ridge LTER welcomes use of the figures and content on this page when accompanied by the following citation:
Niwot Ridge LTER. 2026. Data Dashboard. Retrieved from https://nwt.lternet.edu/streamflow.
We also welcome use of the data linked to on this page when accompanied by the following citations:
Green Lake 4:
Caine, N., J. Morse, and Niwot Ridge LTER. 2025. Streamflow for Green Lake 4, 1981 - ongoing. ver 20. Environmental Data Initiative. https://doi.org/10.6073/pasta/c3fa75cfe47c10fb61d866fe4d75a93a
Albion camp:
Caine, N., J. Morse, and Niwot Ridge LTER. 2025. Streamflow data for Albion camp, 1981 - ongoing. ver 20. Environmental Data Initiative. https://doi.org/10.6073/pasta/00341116ab5c8eac60e641cb1b5c3468
Martinelli basin:
Caine, T., J. Morse, and Niwot Ridge LTER. 2026. Streamflow for Martinelli basin, 1982 - ongoing. ver 17. Environmental Data Initiative. https://doi.org/10.6073/pasta/44b350d46f371082b2cc98490cf36959
Saddle stream:
Caine, T., J. Morse, and Niwot Ridge LTER. 2026. Streamflow data for Saddle stream, 1999 - ongoing. ver 10. Environmental Data Initiative. https://doi.org/10.6073/pasta/c699680482443efff3ad9f30c2c962a1
These data packages are hosted on the Environmental Data Initiative Data Portal. Data packages include additional detailed information about where and how streamflow data are recorded and processed.
Contact Us
If you have questions about the data presented on this page, please email the Niwot Ridge LTER. To learn more about research, education, and outreach conducted by the Niwot Ridge LTER, please visit our website.