
Subalpine Tree Mortality On Niwot Ridge
Researchers from the Niwot Ridge LTER have monitored the survival, production, growth, and seedling recruitment of subalpine forest trees on Niwot Ridge since the early 1980s. These data document increased tree mortality due to rising summer temperatures, a pattern that is most apparent in drier sites (Andrus et al. 2021). To learn more, explore our long-term data on tree mortality, visualized below.
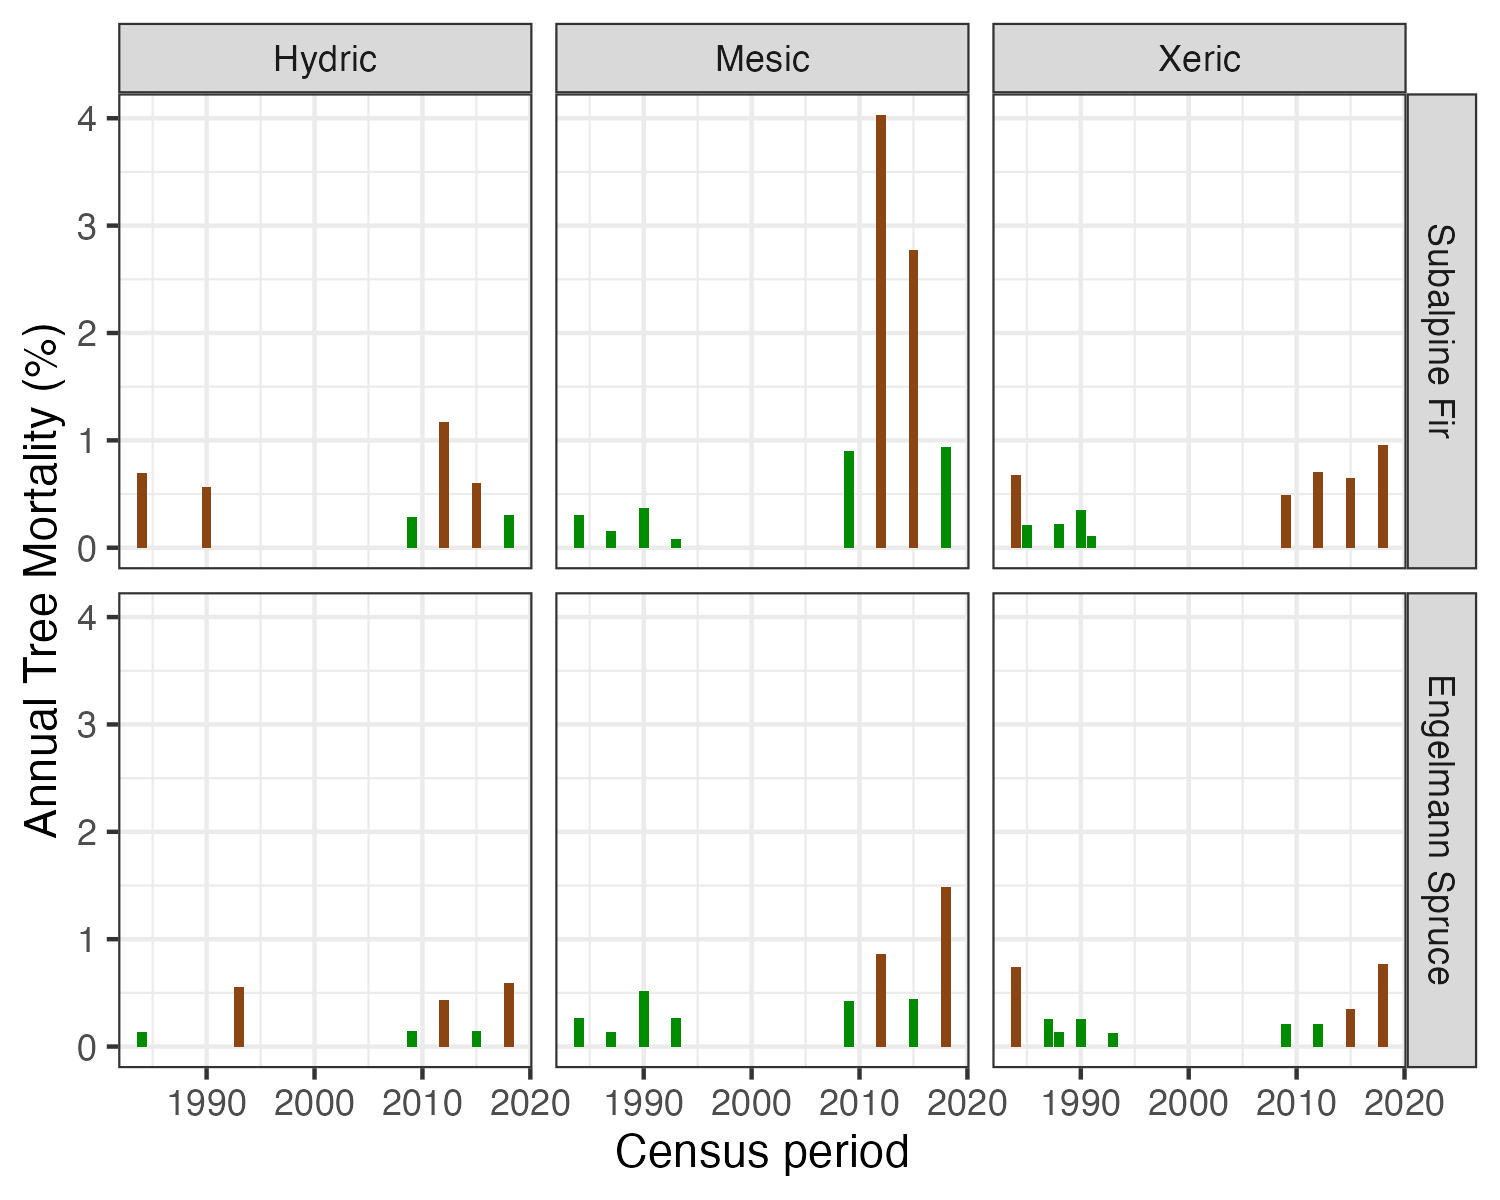
Annual Anomalies in Tree Mortality By Species and Topographic Moisture Class
The below figure visualizes annualized tree mortality for subalpine fir and Engelman spruce in wet (hydric), moist (mesic), and dry (xeric) areas on Niwot Ridge. Bars are colored to indicate how annualized mortality varies relative to the long-term mean; green bars indicate lower mortality than average, while brown bars indicate higher mortality than average.
Download Streamflow Data and Code
The long-term data and code used to make the figures on this page are publicly available on GitHub and the Environmental Data Initiative Portal.
Field Sites:
The long-term tree mortality data visualized on this page come from permanent plots in a subalpine forest near the CU Boulder Mountain Research Station.
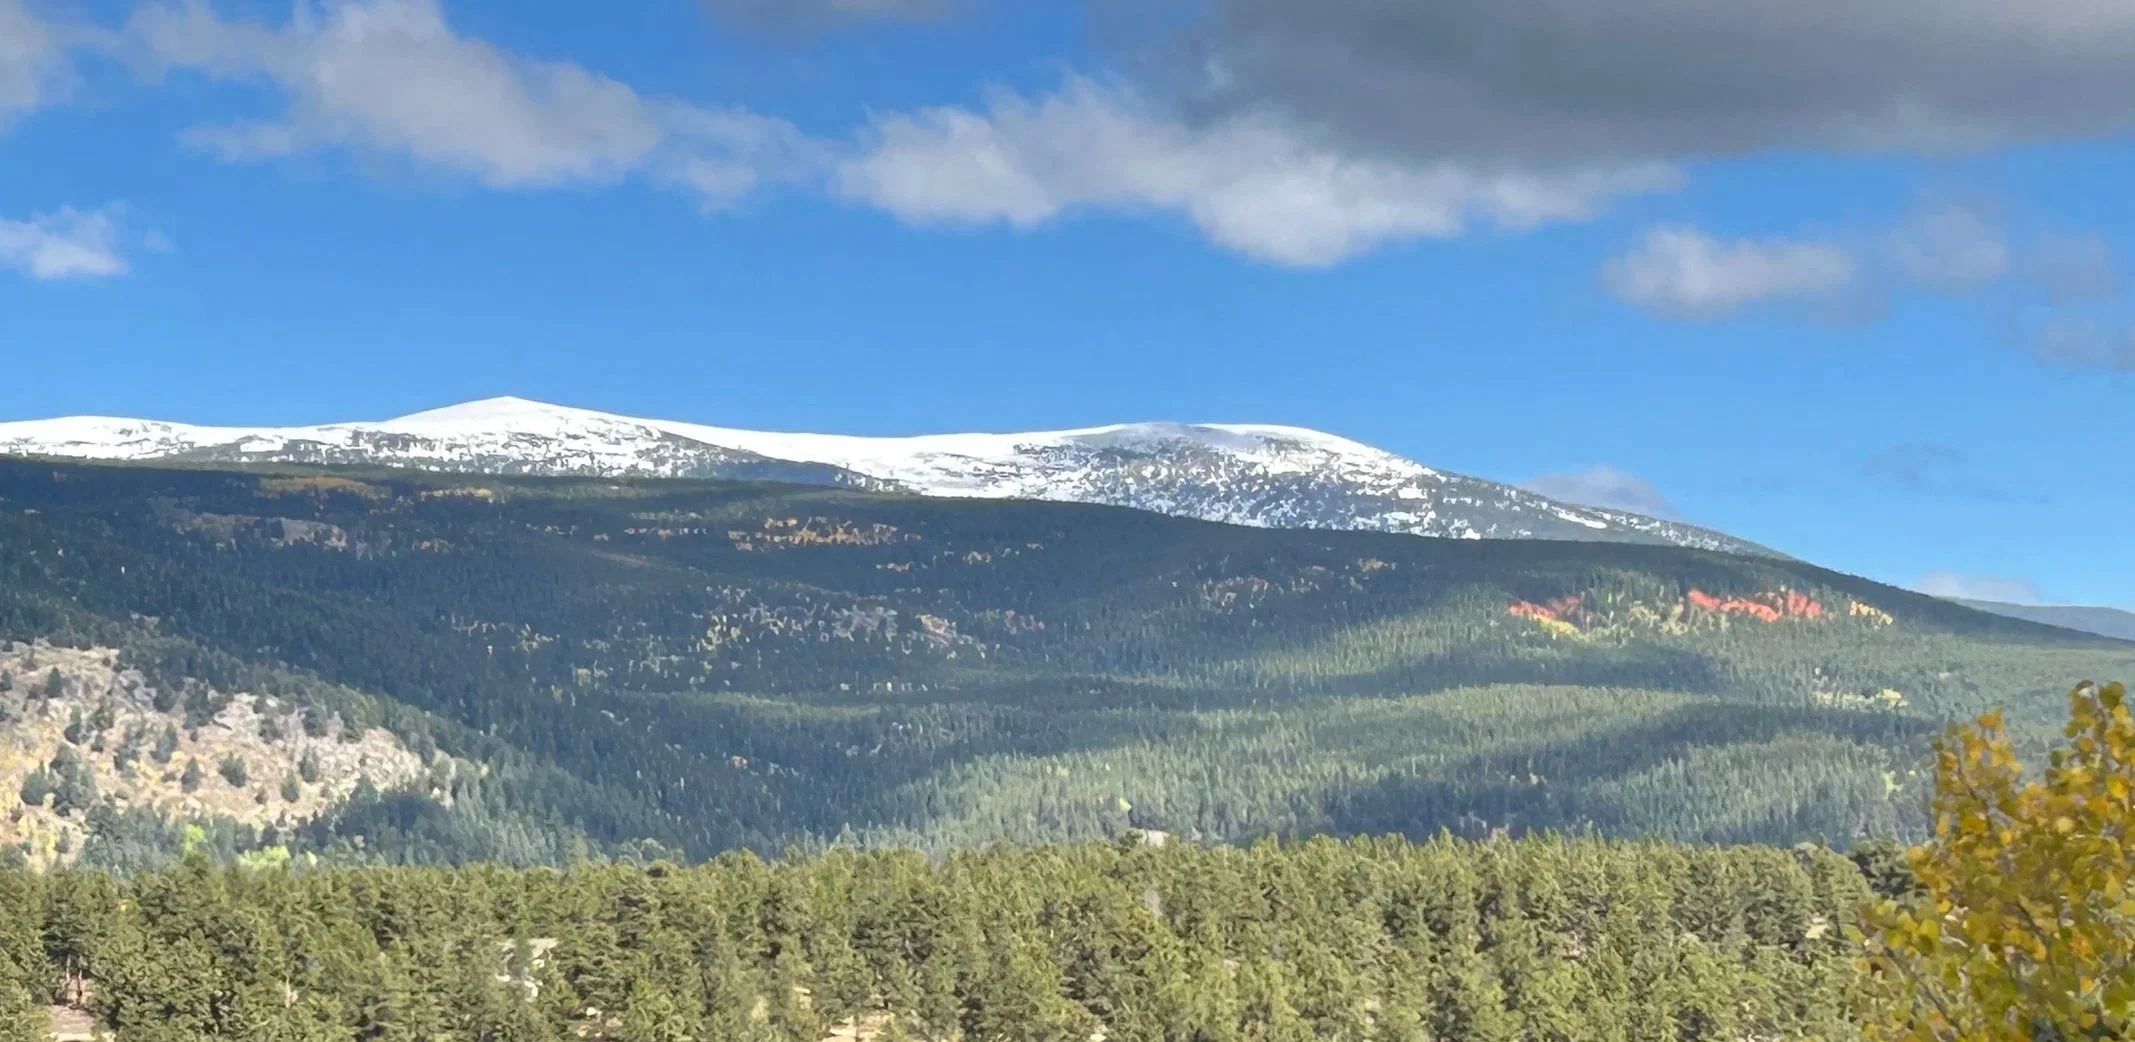
Figure 1: The CU Boulder Mountain Research Station is nestled within a subalpine forest below Niwot Ridge. Photo by Jennifer Morse.
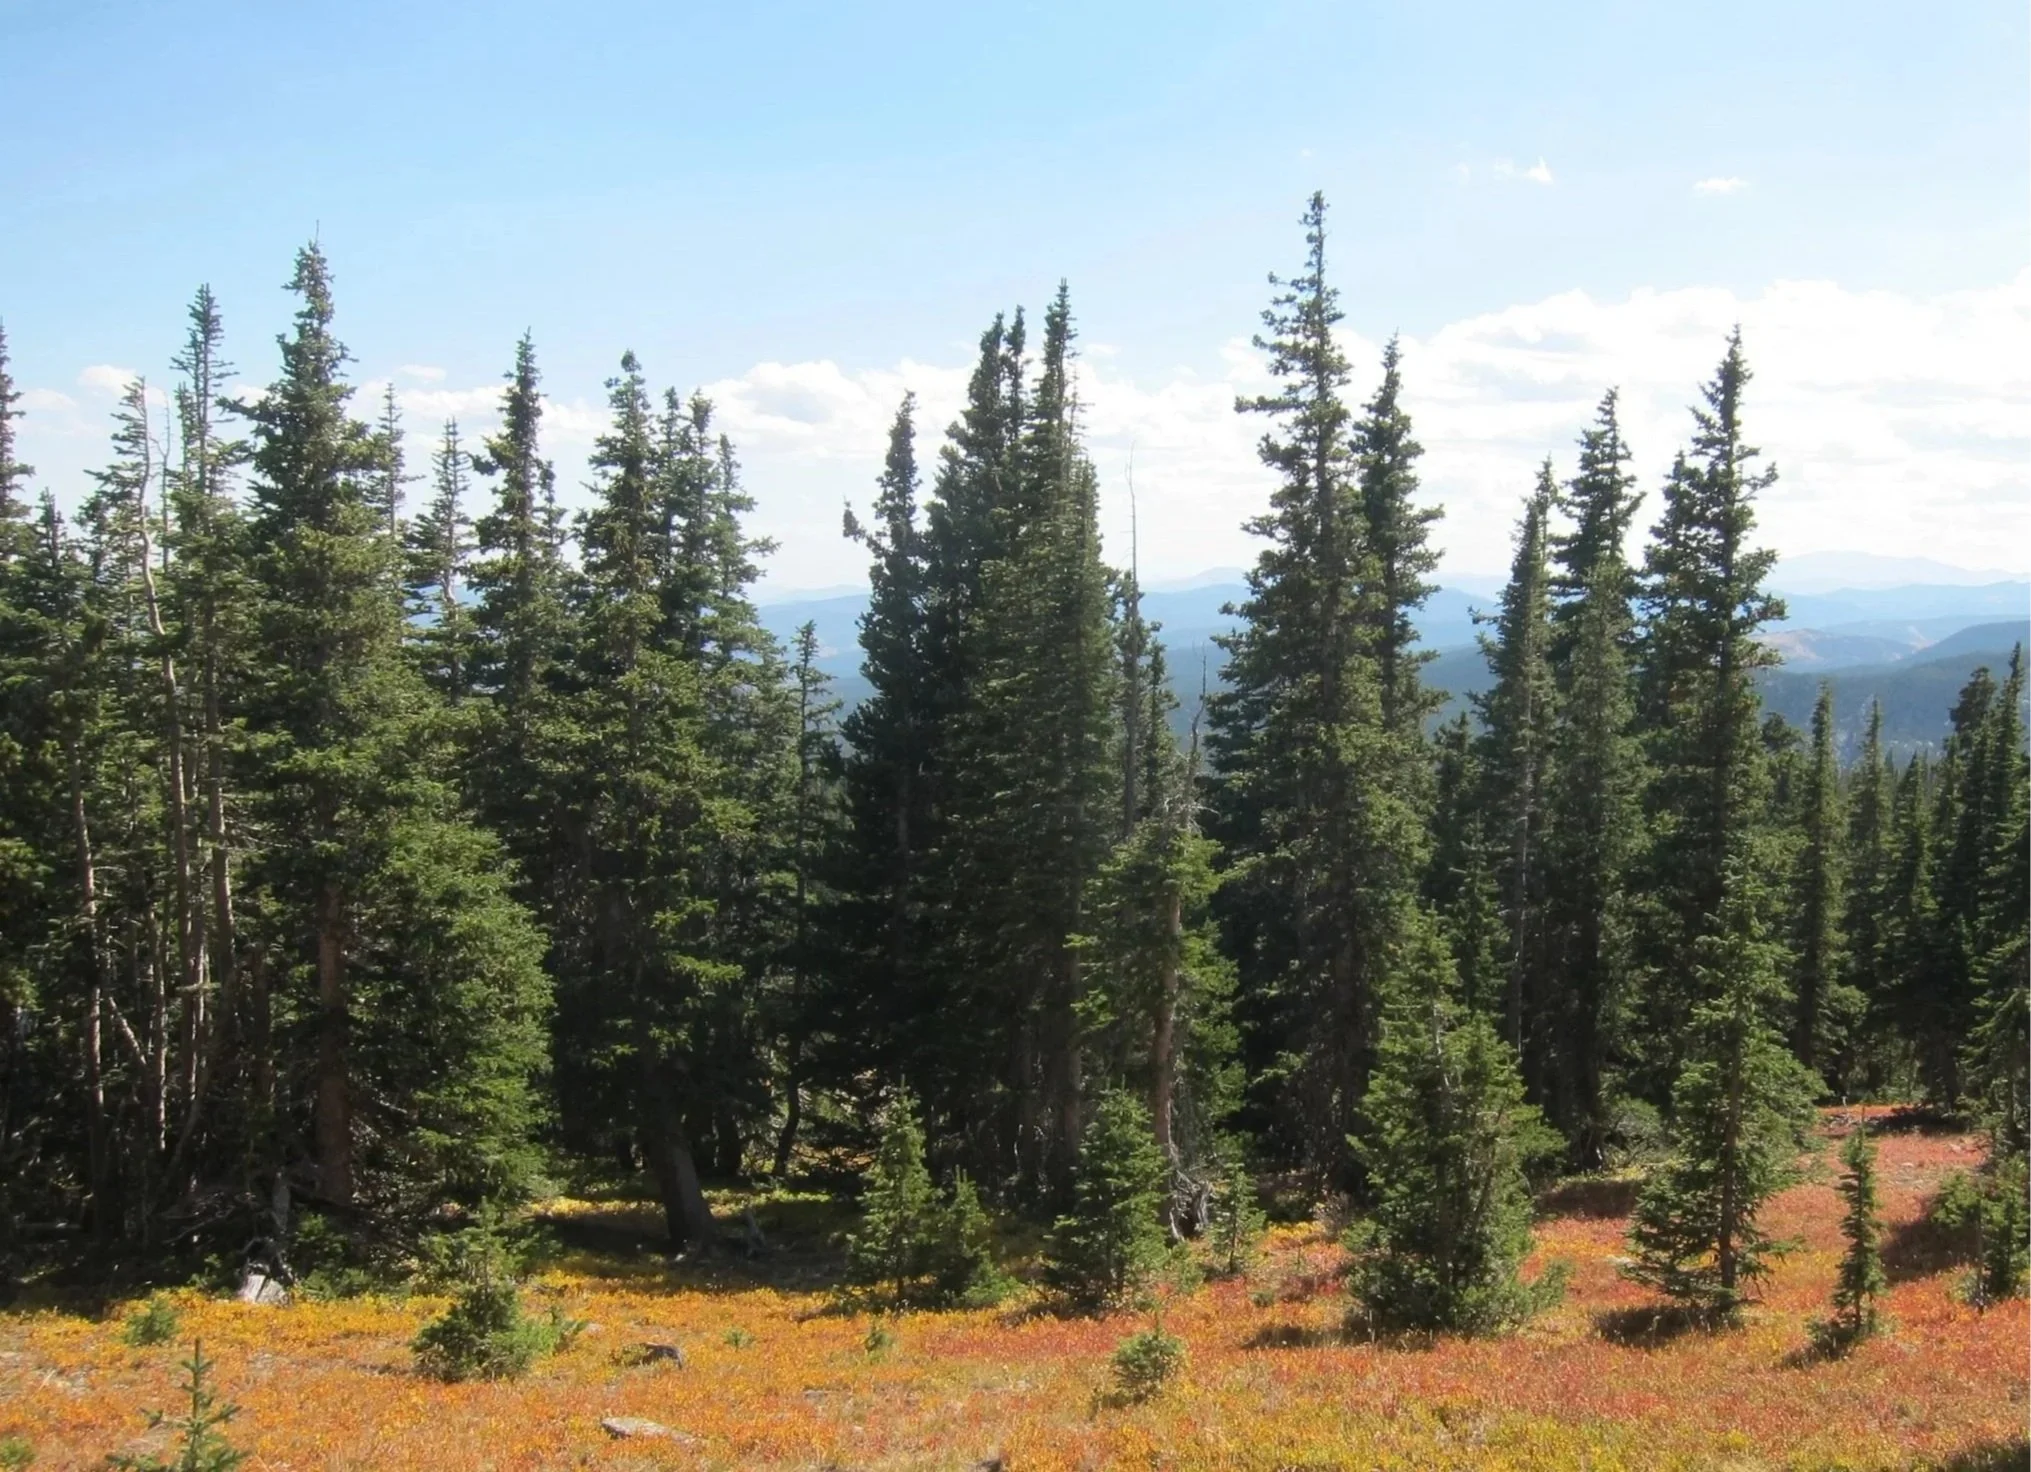
Figure 2: Subalpine forests on Niwot Ridge have been monitored since the early 1980s. Photo by Jane G. Smith.
Data Collection:
Permanent plots were installed in a subalpine forest in the early to mid-1980s (Fig. 3). Plots were located in areas without evidence of prior logging and across gradients of moisture availability. During the initial installation, all trees greater than four centimeters in diameter at breast height were tagged (Fig. 4) and measured for tree size, status (live or dead), and height class (main canopy, intermediate, or subcanopy). The data visualized on this page come from five of these permanent plots. Niwot Ridge LTER researchers census plots for tree mortality (Fig. 5) and ingrowth every 3 years (with the exception of the 1993/1994-2007 period). Researchers also conduct annual surveys, documenting soil moisture, growth (Fig. 6), seed production (Fig. 7) , germination, litter production, and seedling establishment.
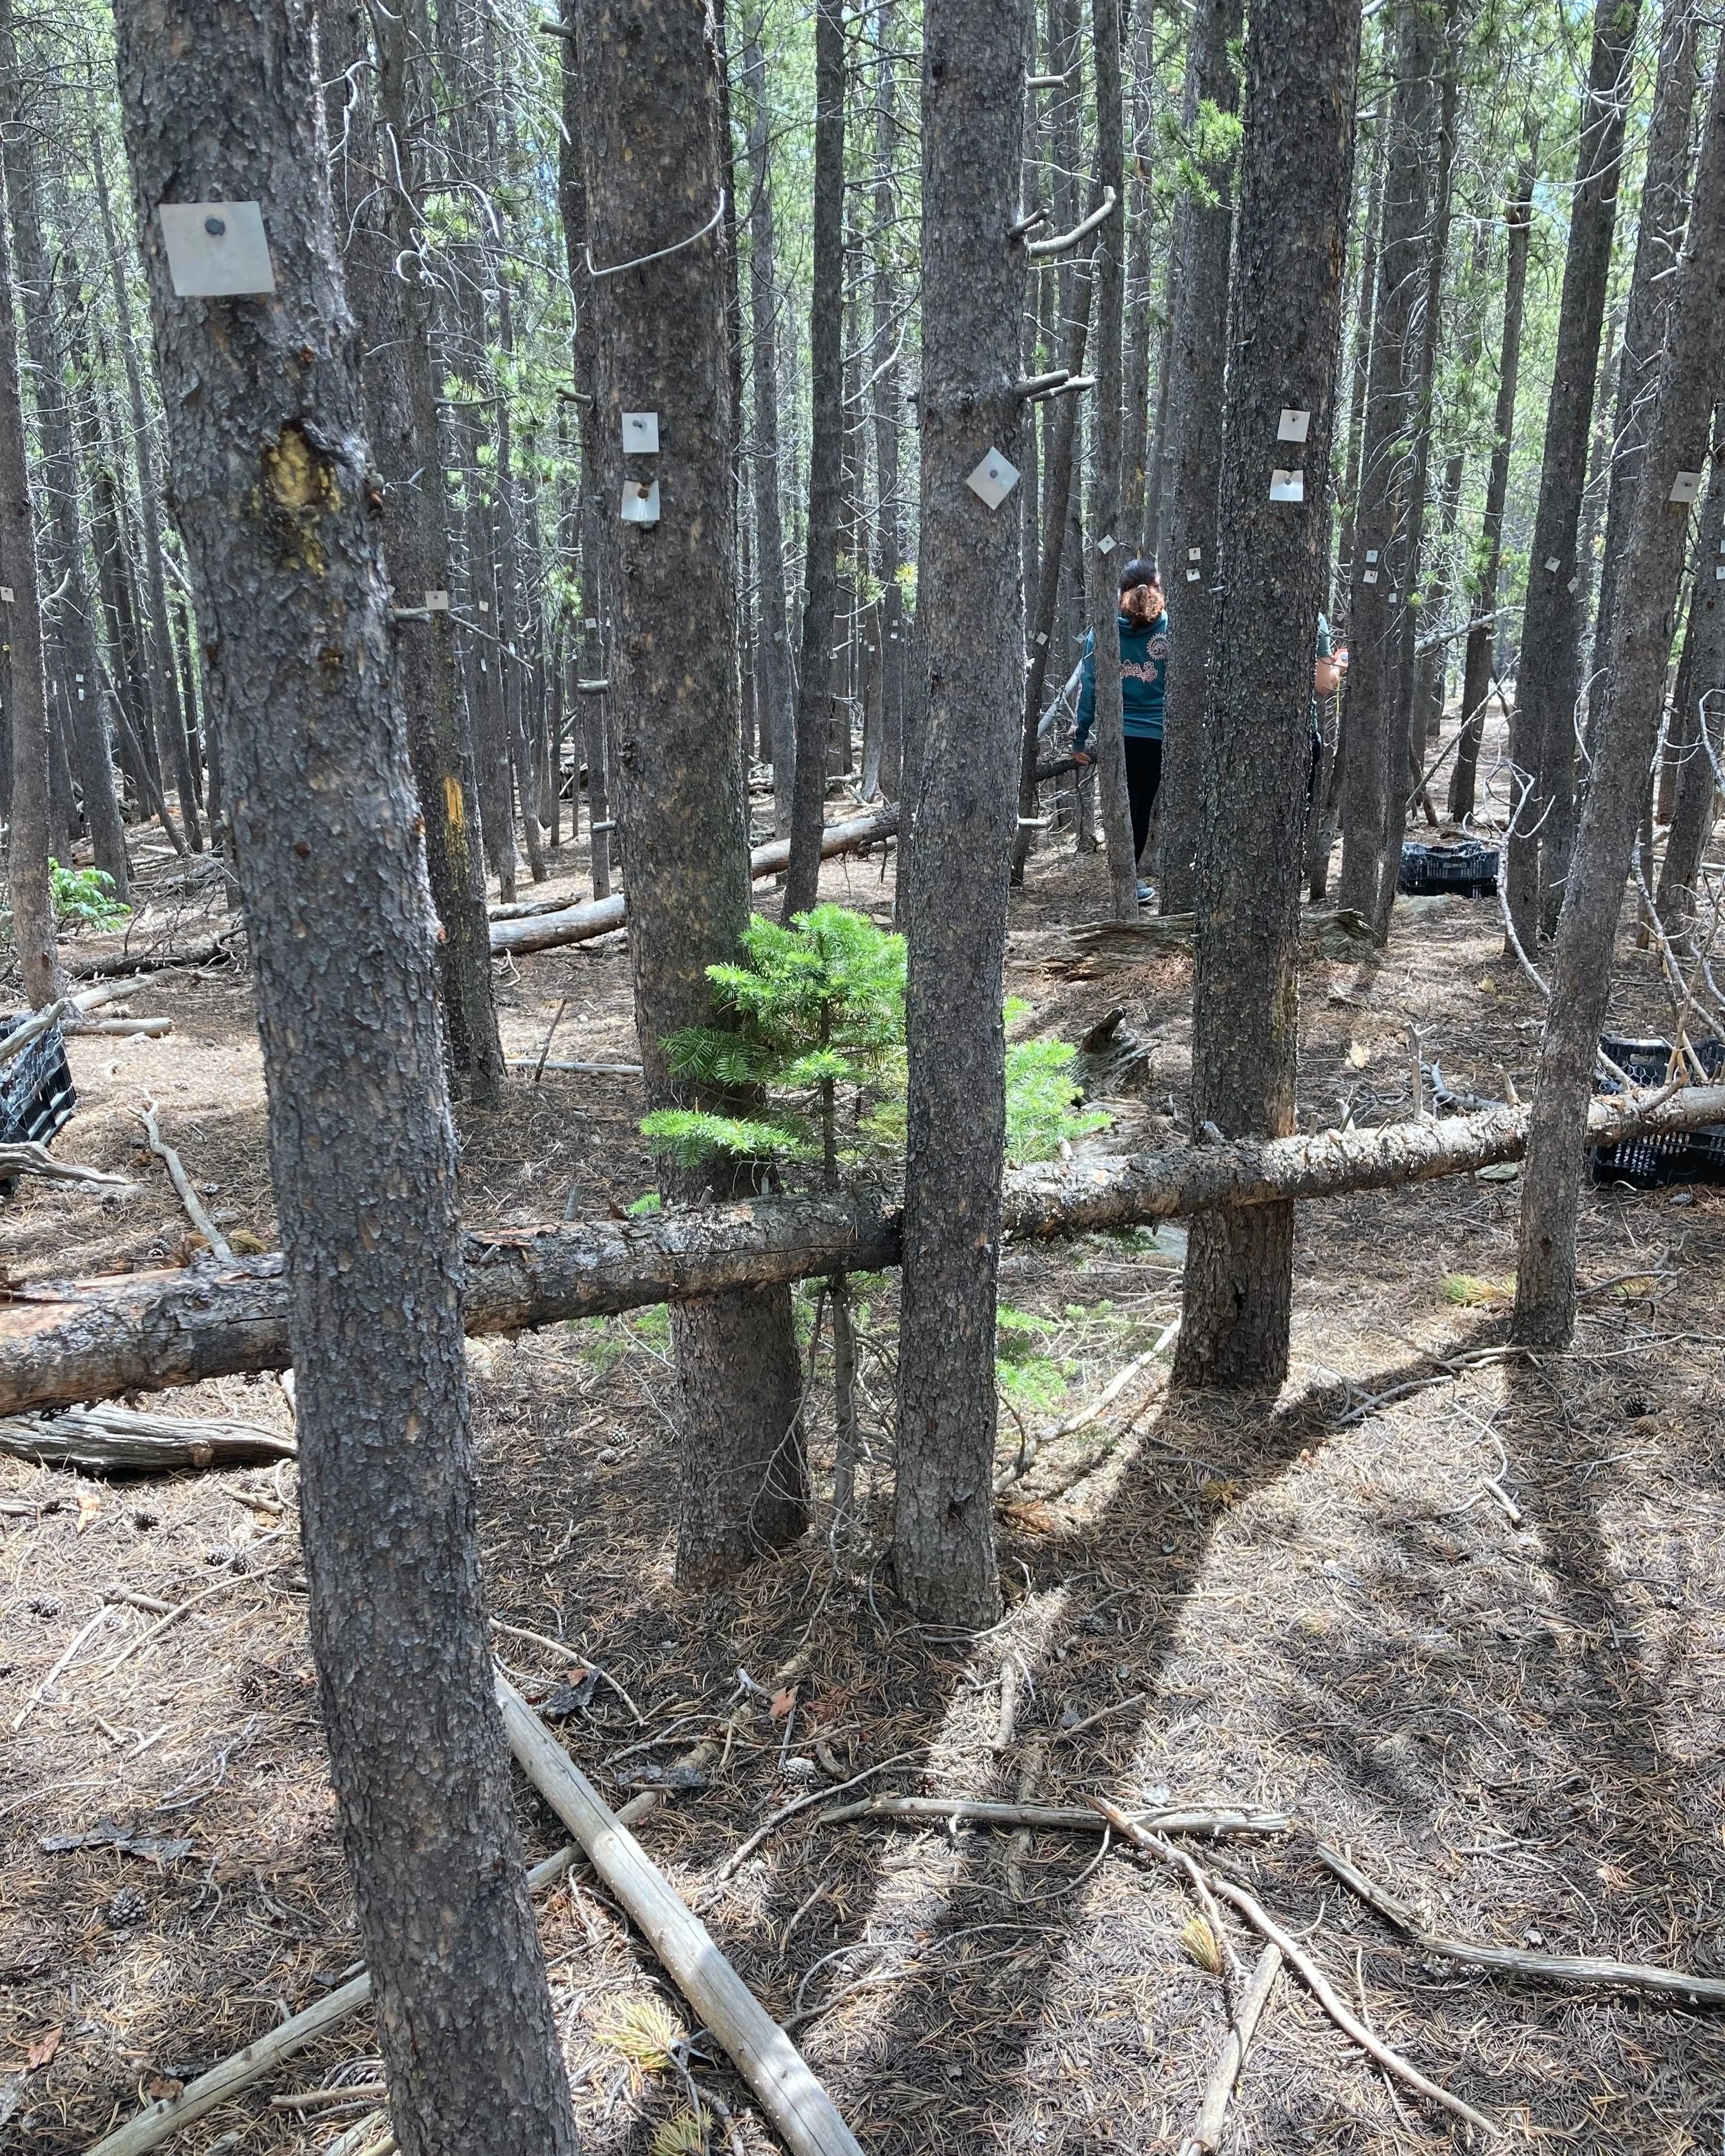
Figure 3: A subalpine forest study plot near the CU Boulder Mountain Research Station. Photo by Sarah Hart.
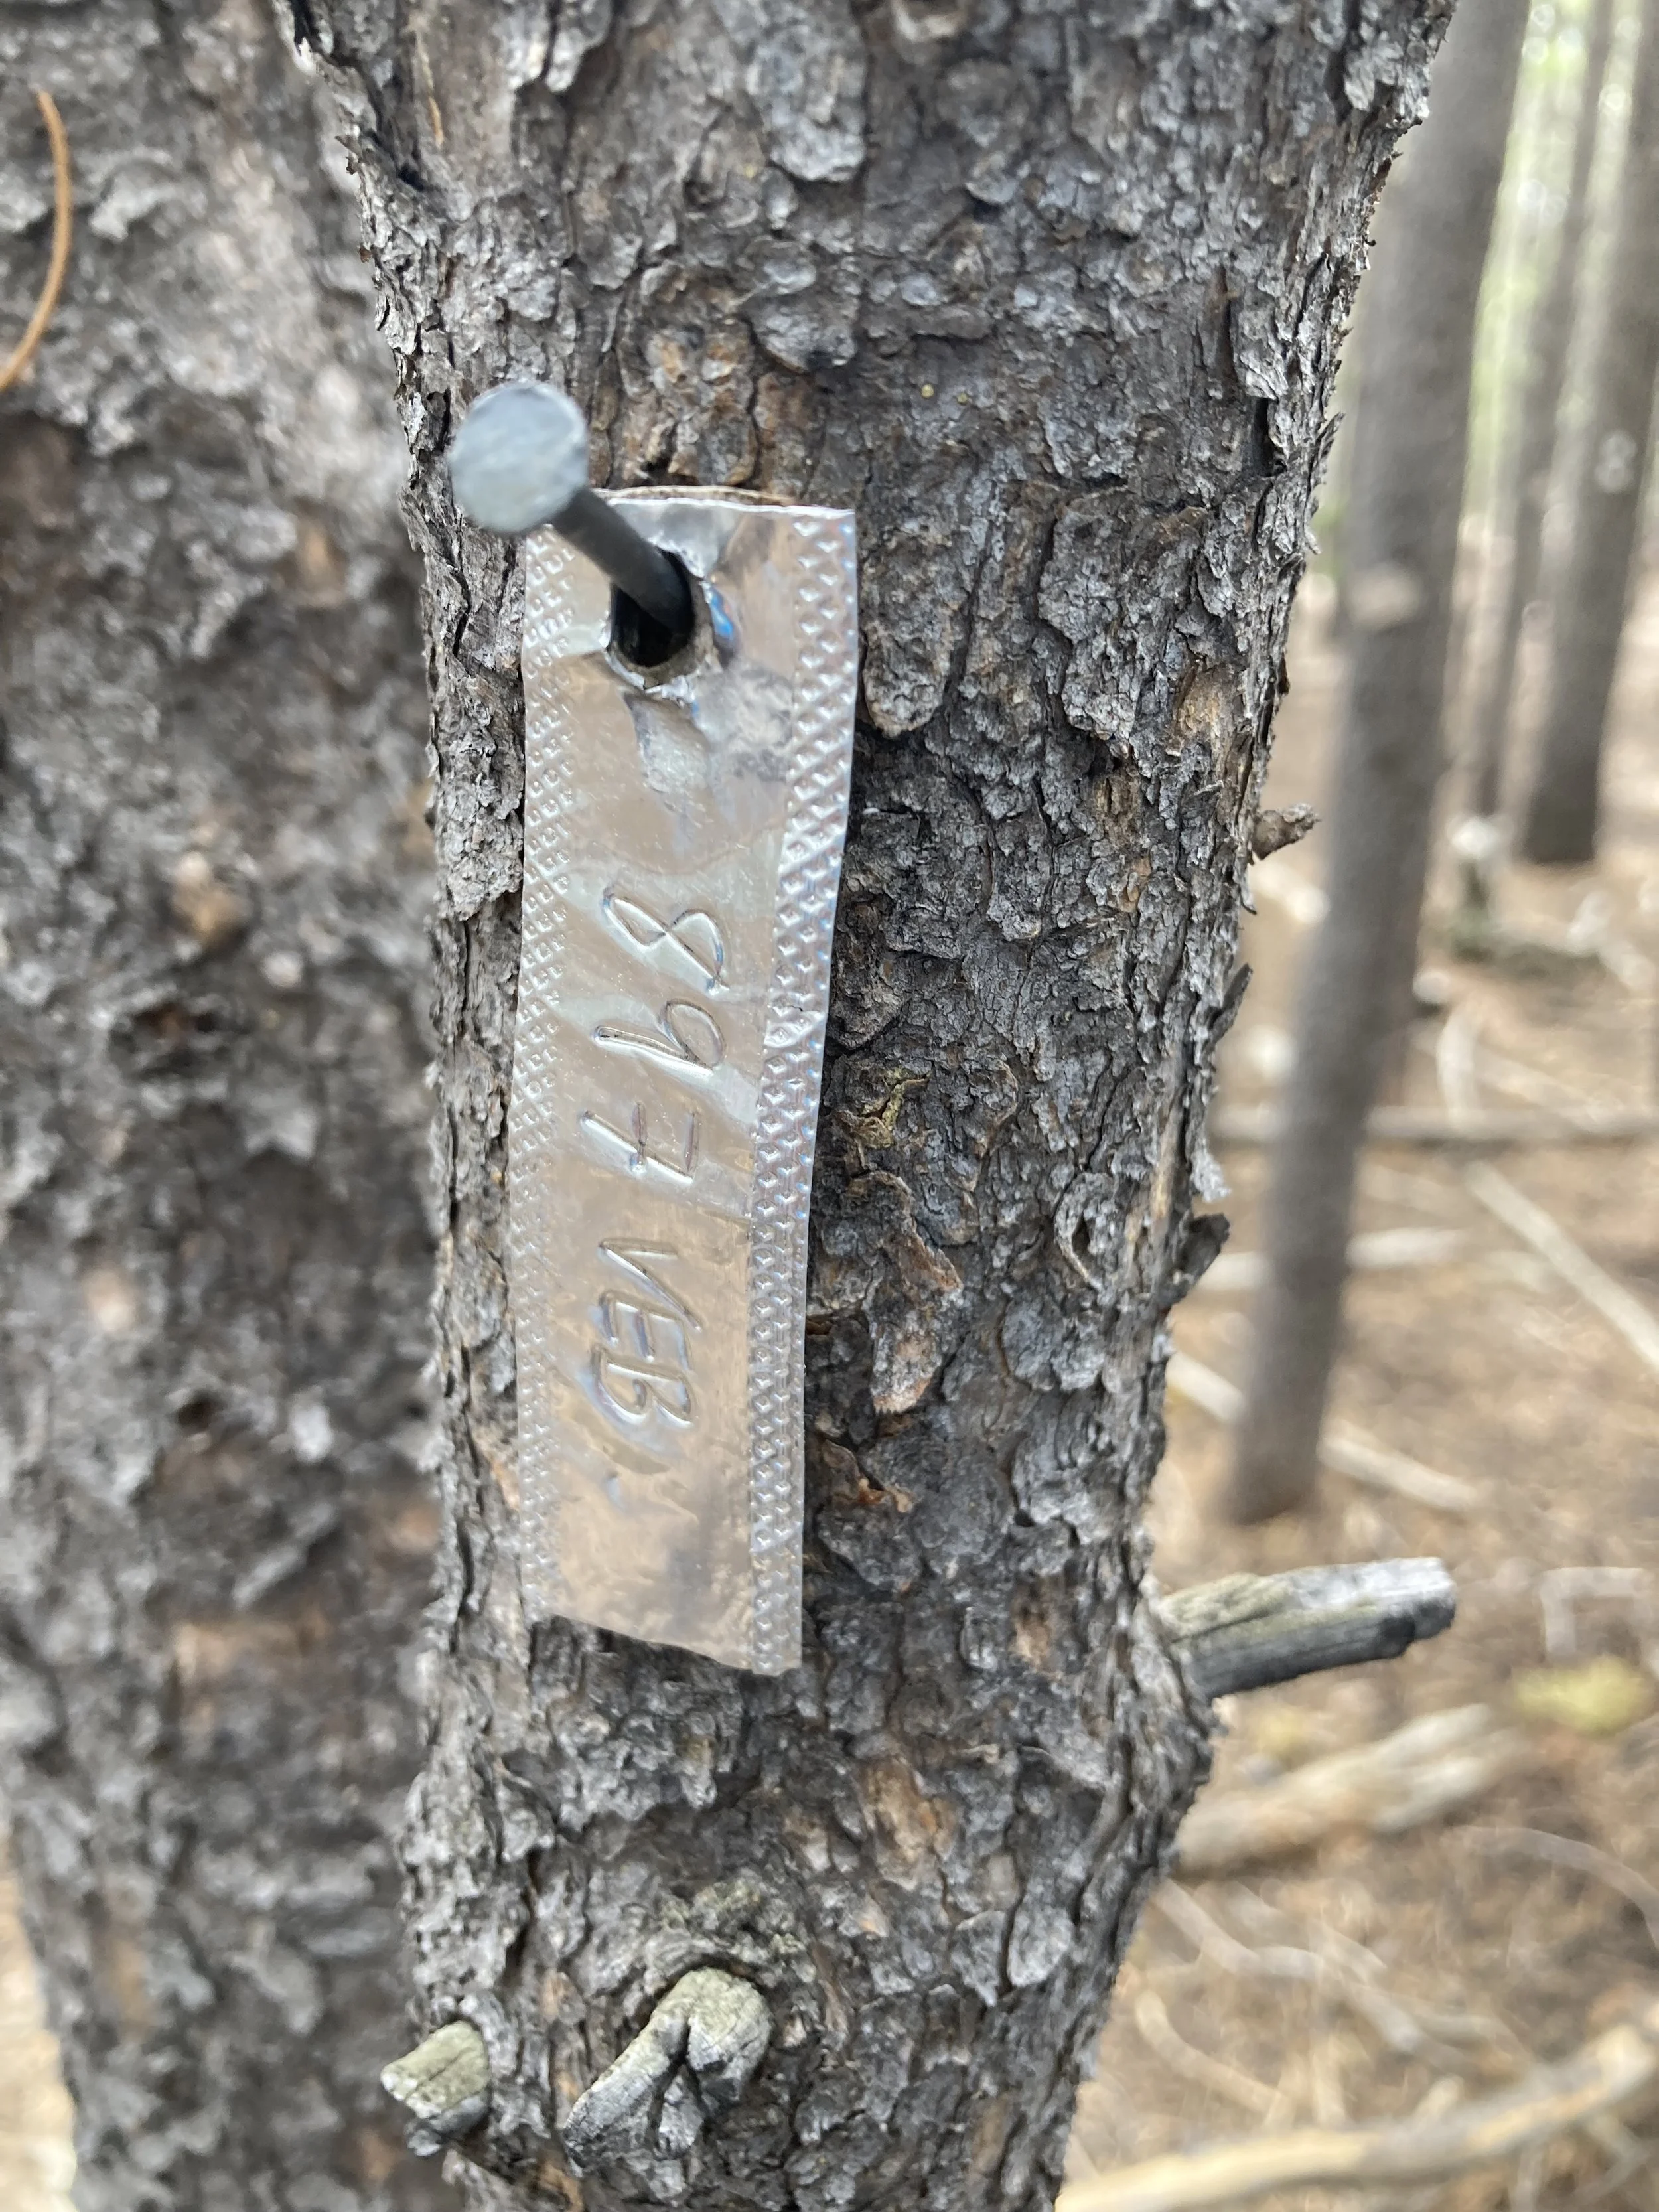
Figure 4: A permanently tagged tree in a long-term study plot. Photo by Sarah Hart.
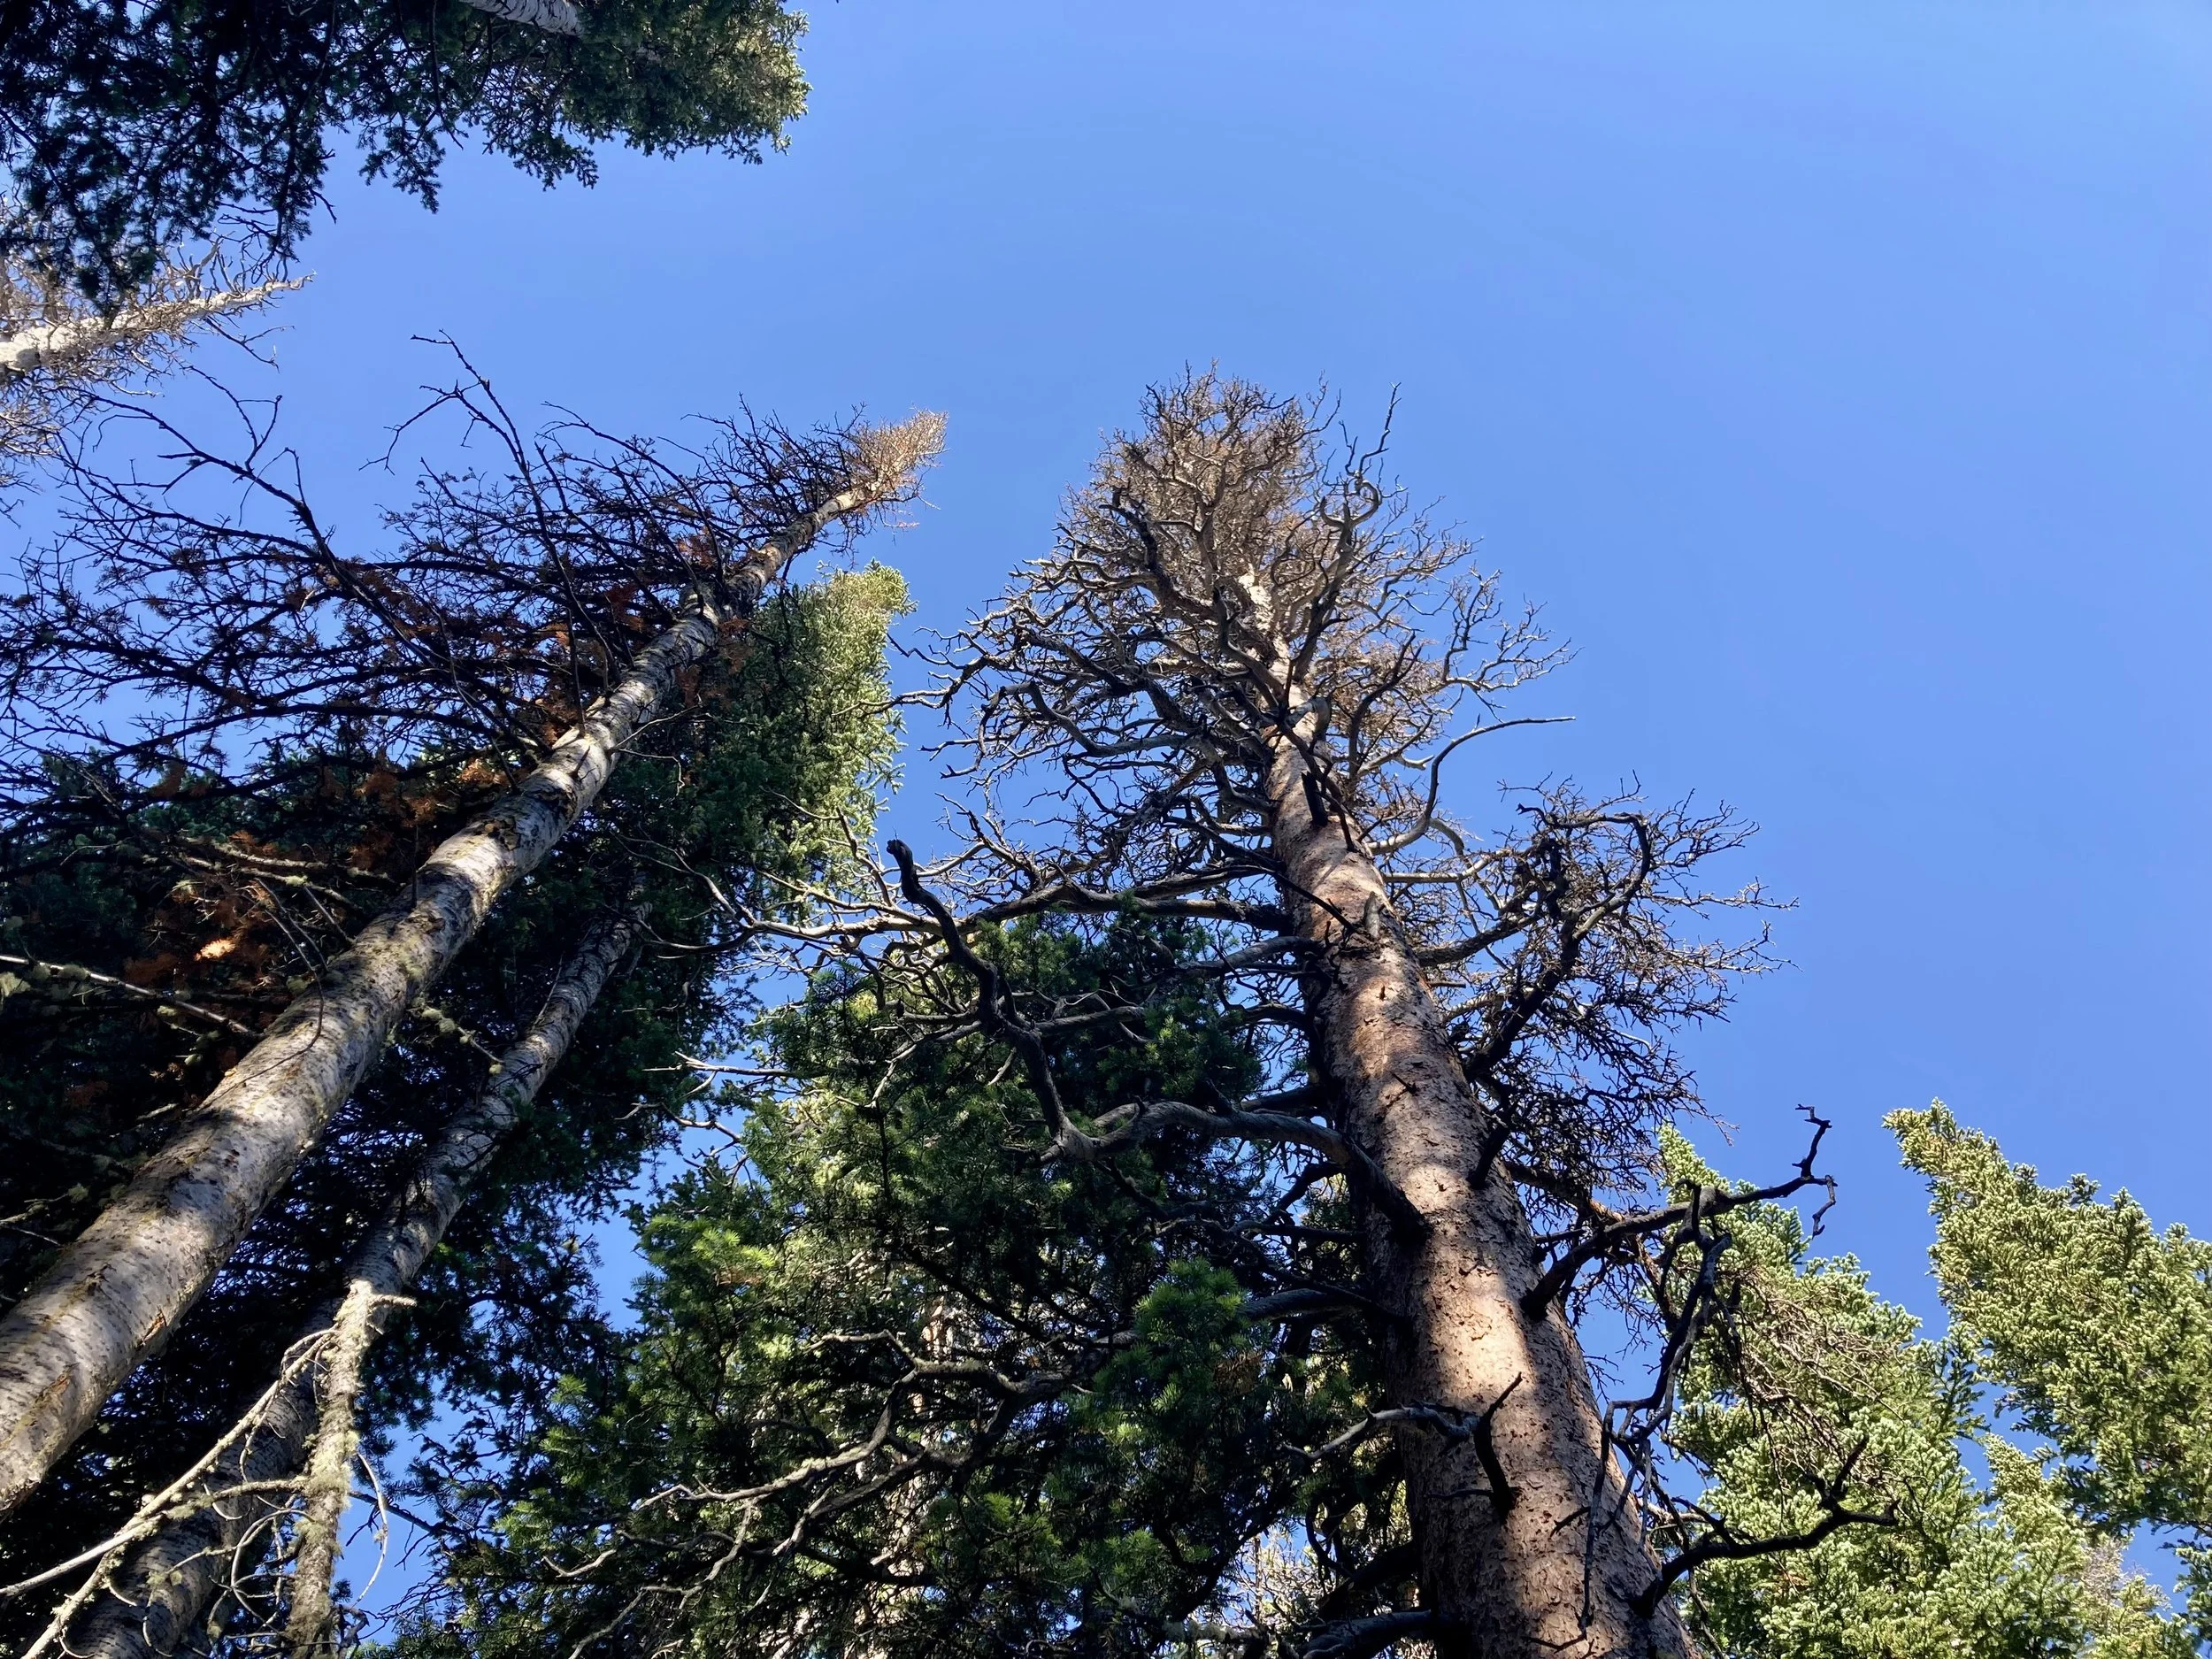
Figure 5: Tree mortality in research study plots. Photo by Sarah Hart.
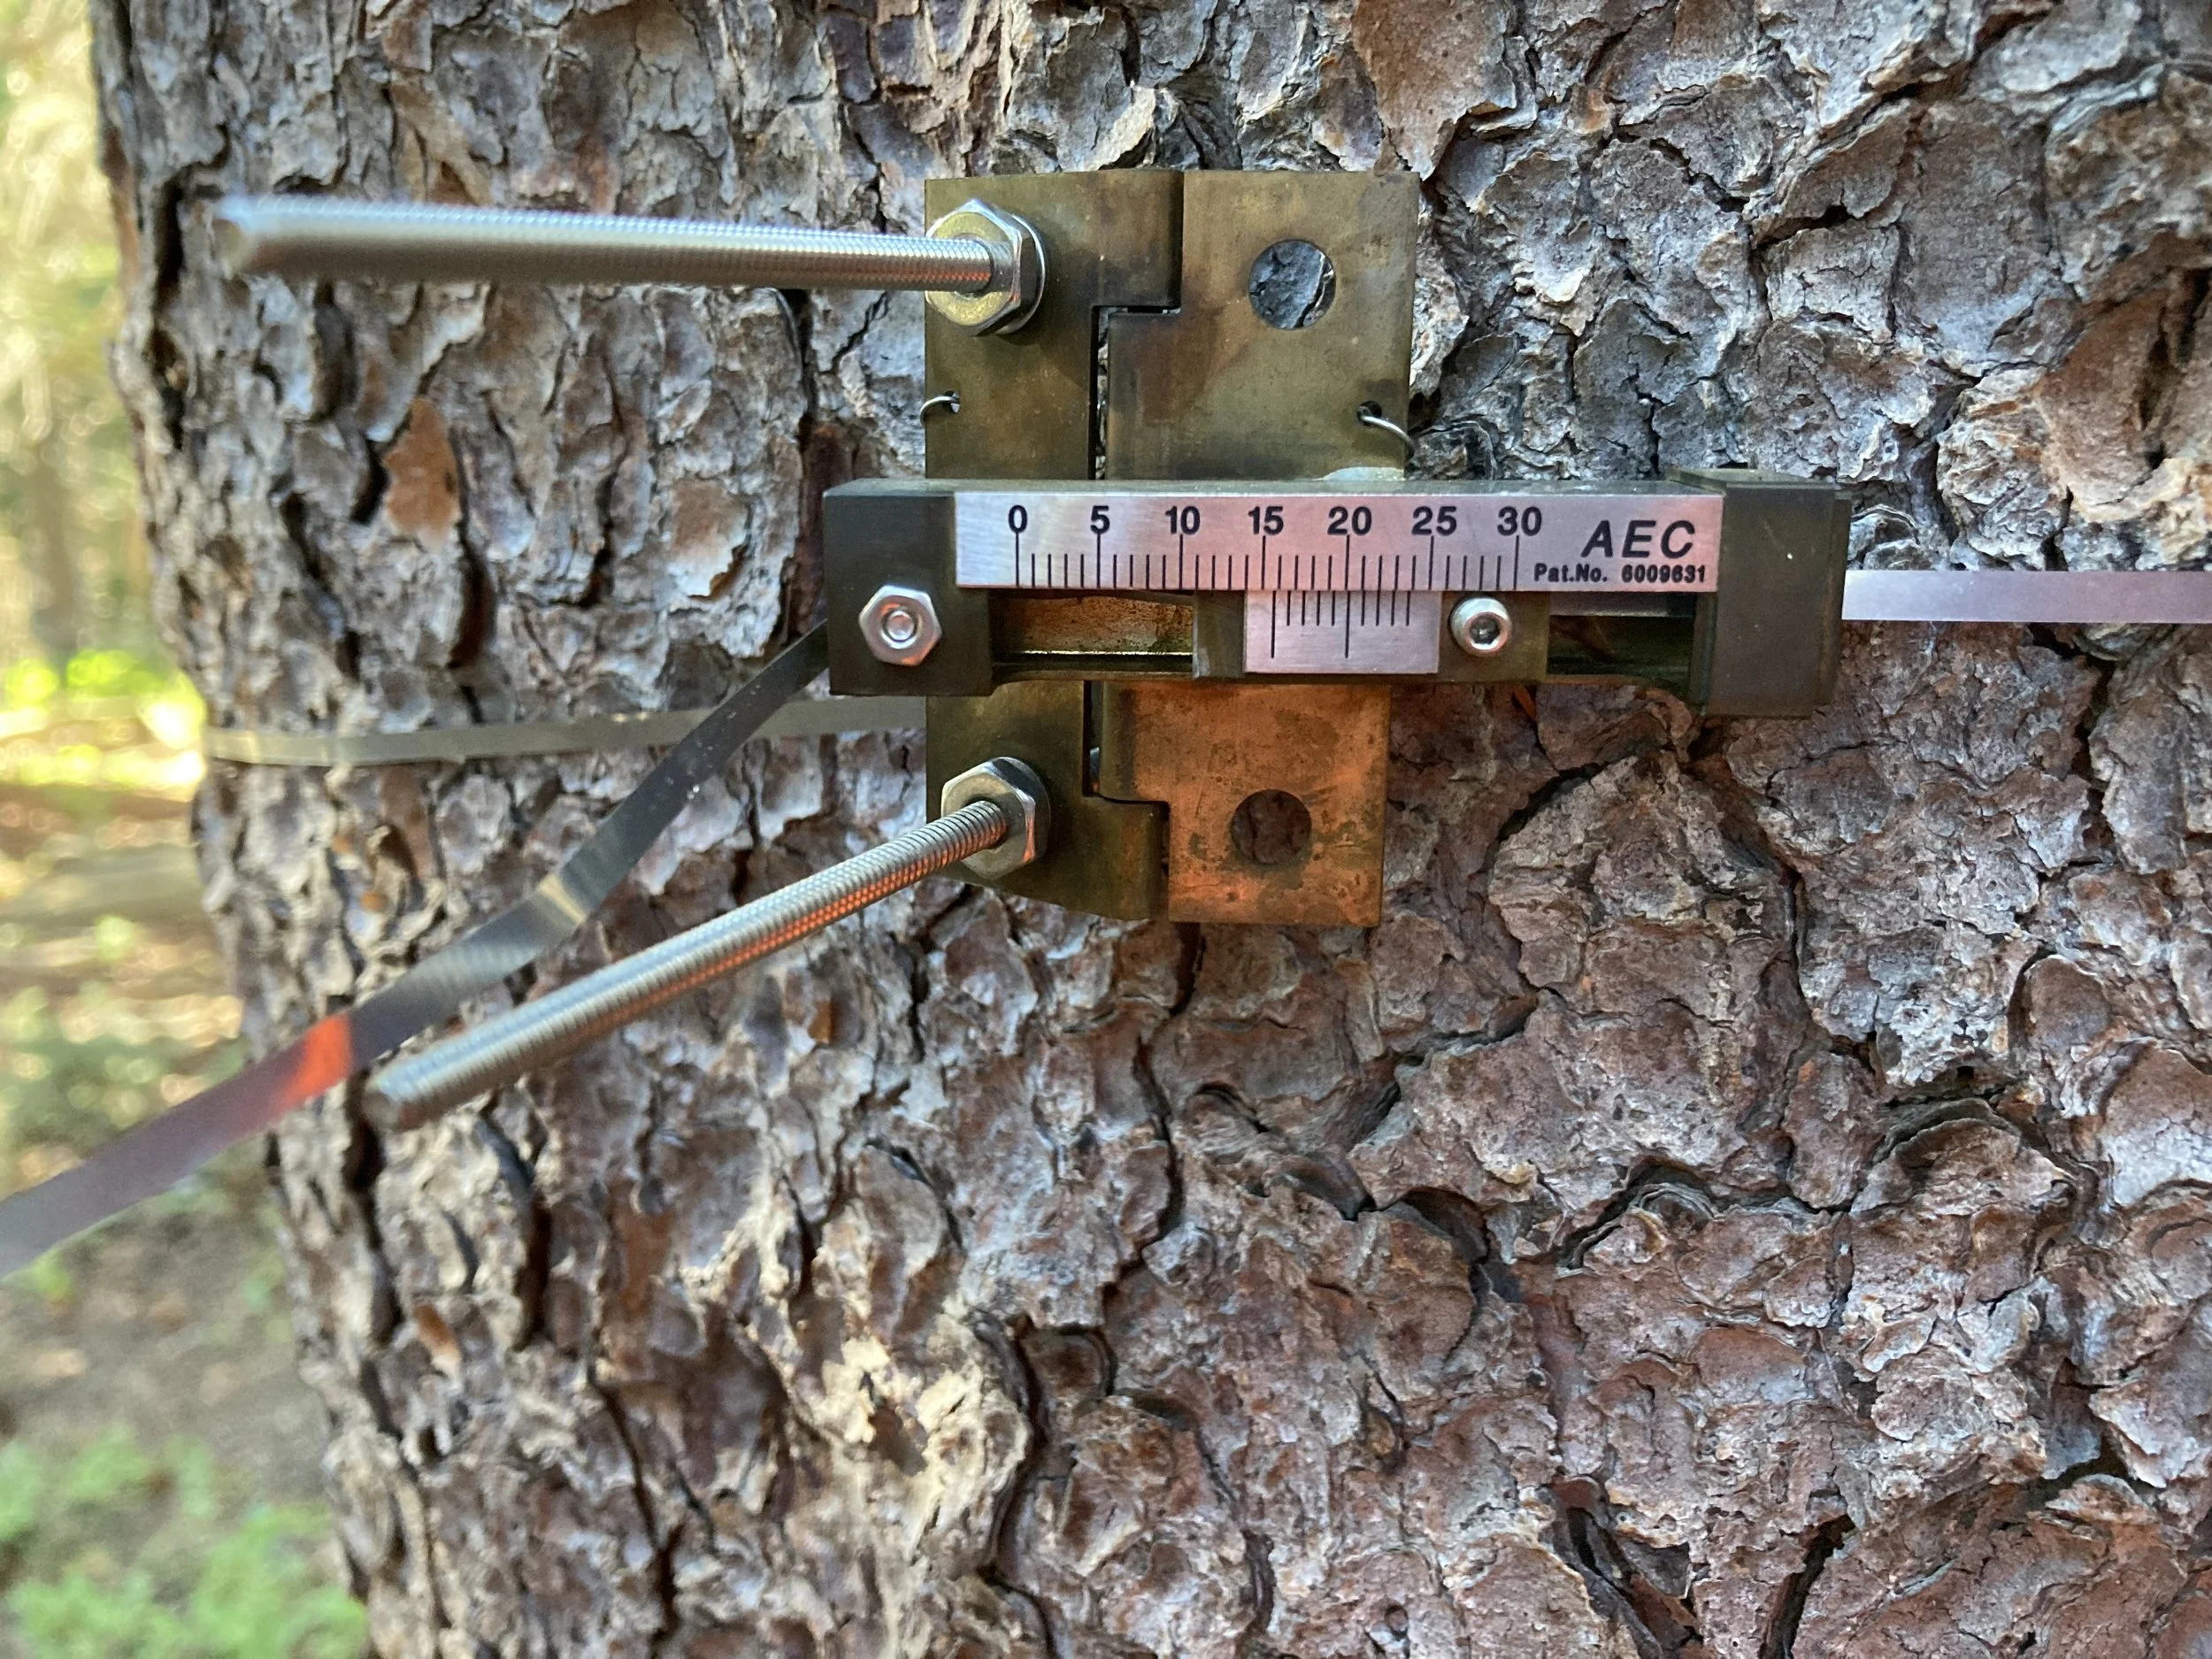
Figure 6: A dendrometer band used to measure annual radial growth. Photo by Sarah Hart.
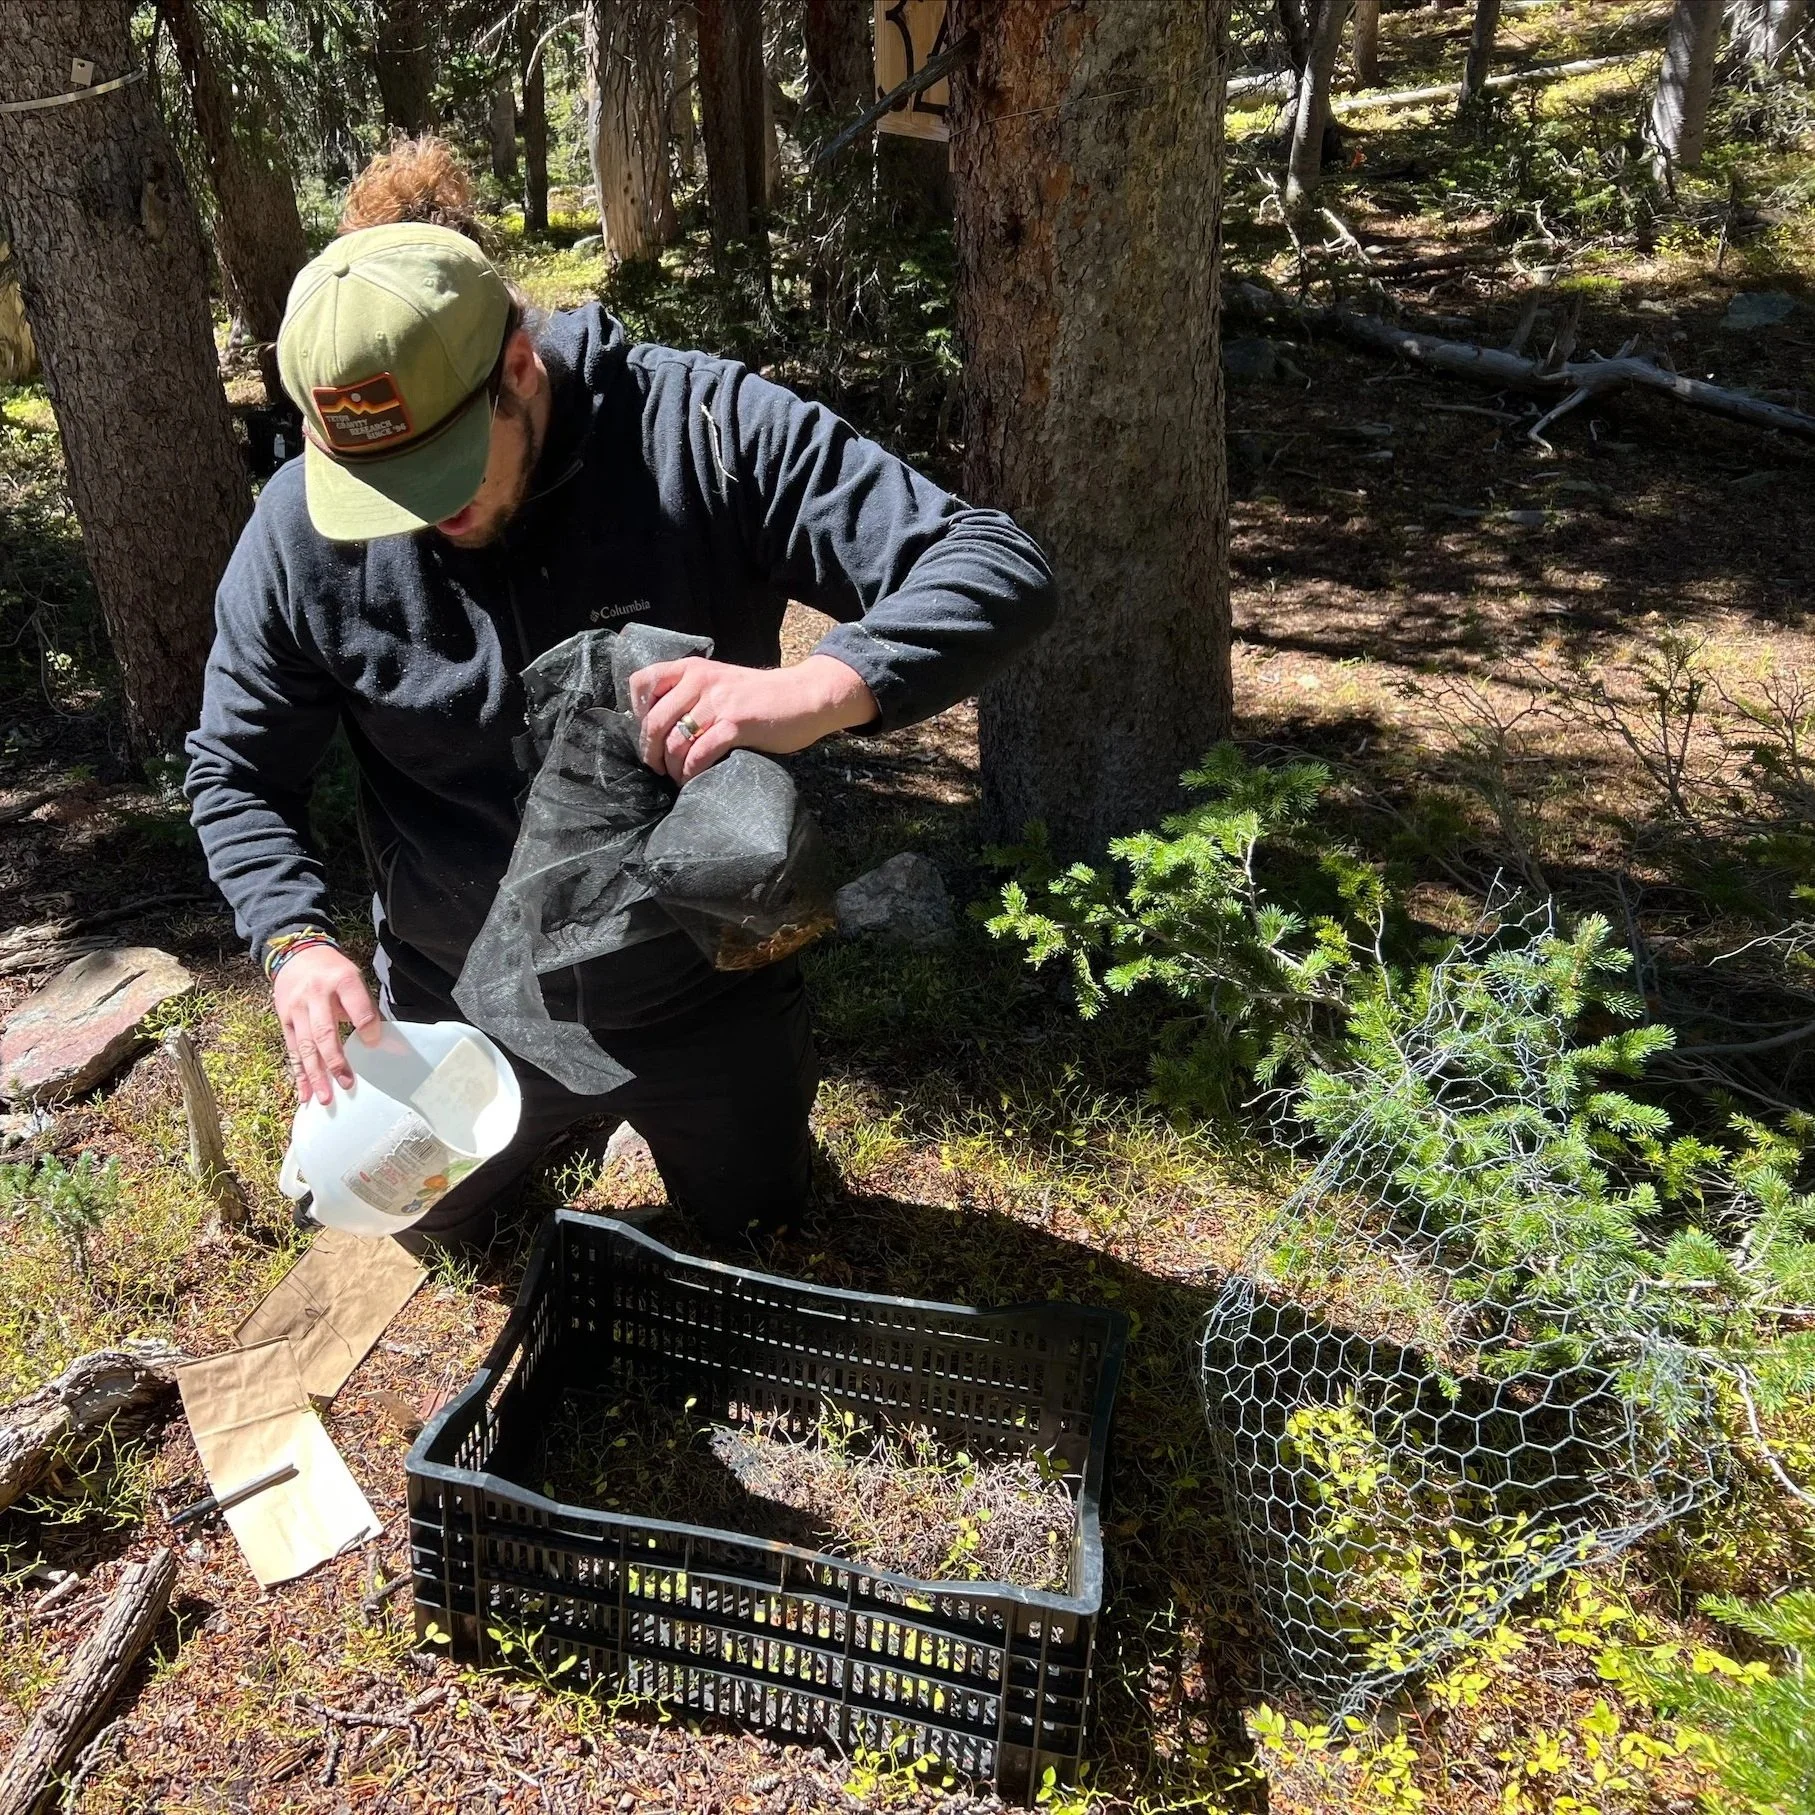
Figure 7: Seed traps capture seeds produced within forest plots. Photo by Sarah Hart.
How To Cite Data and Figures On this page
The Niwot Ridge LTER welcomes use of the figures and content on this page when accompanied by the following citation:
Niwot Ridge LTER. 2026. Data Dashboard. Retrieved from https://nwt.lternet.edu/tree-mortality.
We also welcome use of the data linked to on this page when accompanied by the following citations:
Forest plot data:
Veblen, T., R. Andrus, and R. Chai. 2021. Permanent forest plot data from 1982-2019 at Niwot Ridge, Colorado ver 5. Environmental Data Initiative. https://doi.org/10.6073/pasta/48fa11a8f5bc6541b0472bc3fd4c0c71
Click on the above links to further explore Niwot Ridge tree mortality data packages, which are hosted on the Environmental Data Initiative Data Portal. Data packages include detailed information about where and how our tree mortality data is recorded and processed.
Contact Us
These data packages are hosted on the Environmental Data Initiative Data Portal. Data packages include additional detailed information about where and how tree mortality data are recorded and processed.